
In the competitive world of online retail, making decisions based on gut feelings is a recipe for disaster. The most successful brands are data-driven, leveraging powerful ecommerce analytics tools to understand customer behavior, optimize marketing spend, and maximize profitability. But with a sea of options available, from comprehensive platforms like Google Analytics and Adobe Analytics to more specialized tools like Hotjar and Triple Whale, which one truly provides the insights needed to scale?
This guide cuts through the noise. We move beyond generic feature lists to provide an in-depth, practical analysis of the 12 best ecommerce analytics tools for your business. We'll dive deep into their real-world applications, honest limitations, and the specific problems they solve. For each tool, you'll find screenshots, direct links, and clear guidance on implementation to help you get started quickly.
Our goal is to help you select the right analytics stack to turn raw data into a competitive advantage. To truly unlock the value of your data, understanding and continuously tracking essential marketing performance indicators is crucial for strategic growth. This comprehensive resource will show you which platforms are best suited for tracking the metrics that matter most to your bottom line. Whether you're a startup on Shopify, a growing brand with significant monthly revenue, or an established enterprise, this list will equip you to make a confident, informed decision. Let's find the perfect tool for you.
1. Google Analytics
Google Analytics (GA) is the foundational layer of web analytics for a vast majority of online businesses, and for good reason. It provides a powerful, free suite of tools that track website traffic, user engagement, and conversion events. For eCommerce, its real strength lies in its ability to connect user behavior directly to sales outcomes, making it one of the most essential ecommerce analytics tools available.
Core Features & Use Cases
With Google Analytics 4 (GA4), the platform has become more event-driven, which is ideal for tracking complex user journeys on an eCommerce site. You can monitor everything from initial ad clicks to product page views, add-to-cart actions, and final purchases. This allows you to build detailed sales funnels and identify specific drop-off points in the customer journey. Its seamless integration with Google Ads is a standout feature, enabling you to measure the direct ROI of your paid campaigns by attributing sales back to specific ads and keywords.
Practical Tip: Set up custom events for key interactions like "newsletter signup," "viewed size guide," or "used product filter." This will give you granular data on which features drive engagement and lead to conversions.
Limitations and Considerations
While GA is incredibly powerful, its free version uses data sampling for reports with large datasets, which can lead to less precise insights for high-traffic stores. The transition to GA4 also introduced a steeper learning curve, particularly for those accustomed to the older Universal Analytics. As privacy regulations evolve, some businesses find GA's data collection practices concerning. For those seeking different features or enhanced privacy compliance, it's worth exploring the top Google Analytics alternatives to find a platform that better fits their specific needs.
- Best For: New and growing eCommerce businesses needing a comprehensive, free analytics solution.
- Pricing: Free, with an enterprise-level version (Analytics 360) available for very large businesses.
- Website: https://analytics.google.com
2. Shopify Analytics
For businesses built on the Shopify platform, Shopify Analytics offers a seamless, built-in solution for understanding store performance. Its primary advantage is its native integration, which eliminates setup complexities and provides immediate access to sales and customer data directly within the admin dashboard. This makes it one of the most convenient ecommerce analytics tools for Shopify merchants who need quick, actionable insights without leaving their primary workspace.

Core Features & Use Cases
Shopify Analytics excels at providing clear, commerce-focused reports. You can easily track key metrics like total sales, average order value, and conversion rates over time. Its reports allow you to identify your best-selling products, understand which marketing channels are driving the most traffic and sales, and analyze customer behavior, such as returning customer rates. This integration makes it simple to connect marketing efforts directly to revenue without complex attribution modeling.
Practical Tip: Use the "Sales by traffic source" report to identify your most valuable marketing channels. If you notice a high conversion rate from your email campaigns, consider investing more in building your email list and creating targeted promotions.
Limitations and Considerations
While incredibly user-friendly, Shopify Analytics is not as deep or customizable as standalone platforms like Google Analytics. Its reporting capabilities are powerful for top-level insights but lack the granular, event-based tracking needed for complex user journey analysis. The level of detail also varies by Shopify plan, with advanced reports reserved for higher tiers. For a more comprehensive view, merchants often use Shopify Analytics in tandem with GA. To get the most out of the platform, it's beneficial to explore a guide to mastering the Shopify Analytics dashboard and unlock its full potential.
- Best For: Shopify store owners who need a convenient, integrated, and easy-to-understand overview of their business performance.
- Pricing: Included with all Shopify plans (from $29/month), with more advanced reports available on higher-tier plans.
- Website: https://www.shopify.com
3. Mixpanel
Mixpanel moves beyond traditional web traffic metrics to focus on product analytics, helping you understand precisely how users interact with your digital product. While Google Analytics tells you what happened on your site, Mixpanel excels at explaining the why behind user actions. It’s an event-based platform, making it a powerful choice among ecommerce analytics tools for businesses wanting to optimize user experience and feature adoption.
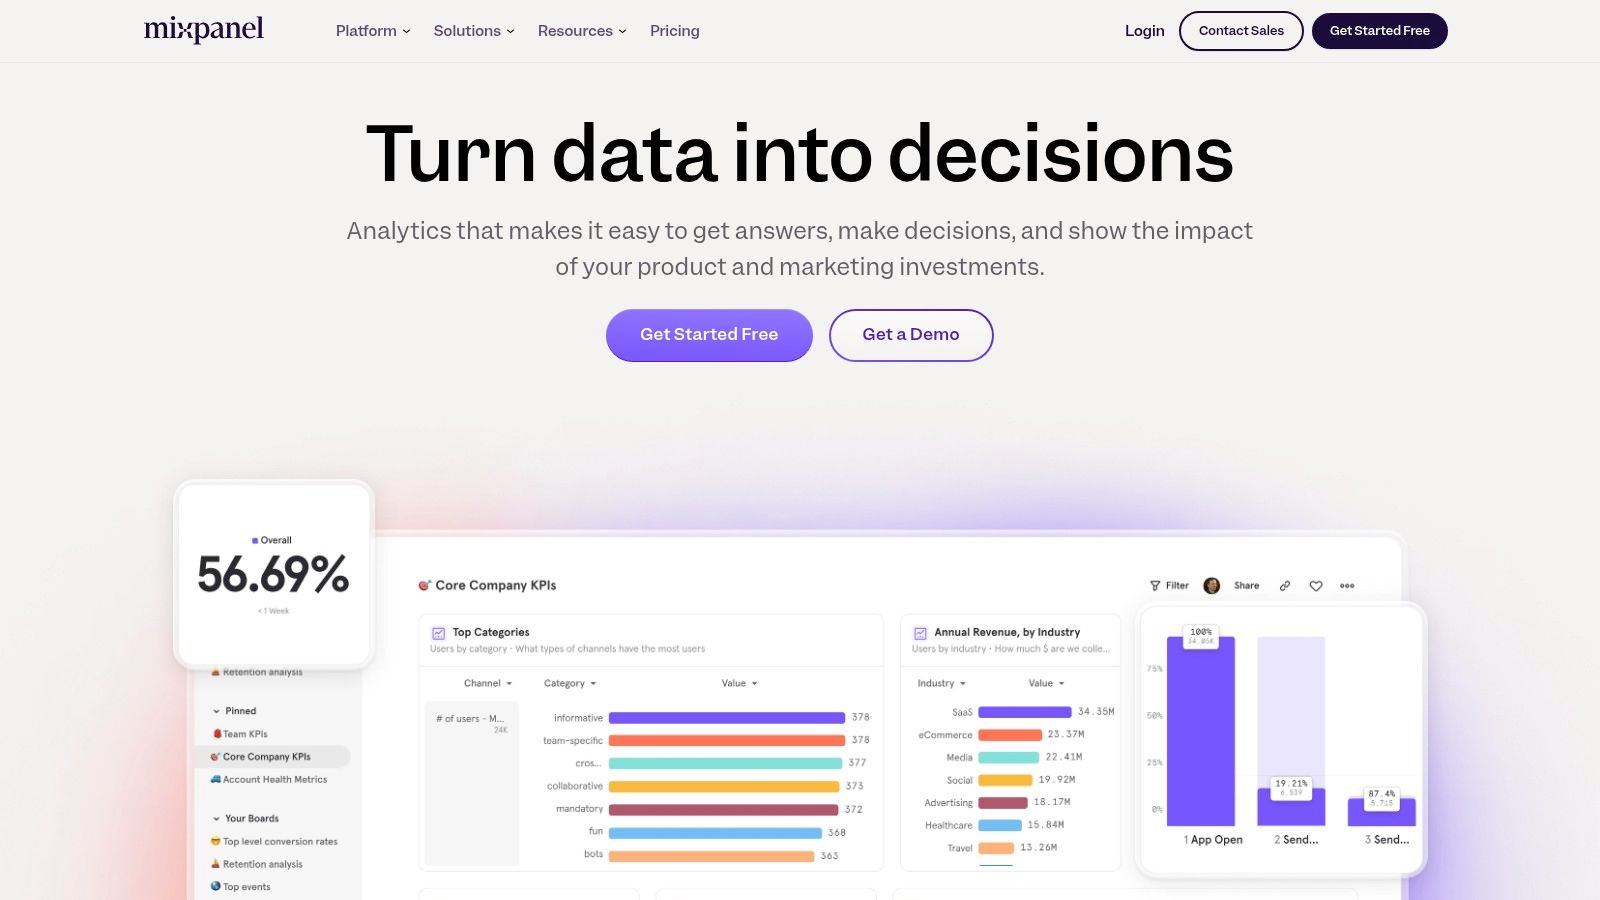
Core Features & Use Cases
Mixpanel’s strength lies in its funnel and retention analysis. You can build highly detailed funnels to track users through multi-step processes, like account creation, onboarding, or complex checkout flows. Its cohort analysis allows you to group users by shared characteristics or actions and track their behavior over time, which is invaluable for measuring the long-term impact of a new feature launch or marketing campaign. For instance, you can see if users who engaged with a new product recommendation engine have a higher lifetime value.
Practical Tip: Use Mixpanel’s "Flows" report to visualize the most common paths users take after a specific action, like viewing a product. This can uncover unexpected user journeys and highlight opportunities for new navigation paths or features.
Limitations and Considerations
The biggest hurdle with Mixpanel is its setup. Because it's event-based, it requires careful planning and developer resources to implement tracking for every important user interaction. This can be more complex than the standard script installation for other platforms. Furthermore, its pricing model is based on monthly tracked users, which can become costly for high-traffic B2C ecommerce sites or those with a large number of anonymous visitors.
- Best For: Product-focused eCommerce businesses that want to deeply analyze user behavior and improve feature engagement.
- Pricing: Offers a generous free plan for up to 20M events/month. Paid plans (Growth and Enterprise) are based on the number of monthly tracked users.
- Website: https://mixpanel.com
4. Matomo
Matomo presents itself as a powerful, privacy-first alternative in the world of ecommerce analytics tools. As an open-source platform, its main draw is giving you 100% data ownership, ensuring compliance with strict privacy laws like GDPR and CCPA. This ethical approach doesn't come at the cost of functionality; Matomo provides a comprehensive suite of features to analyze and optimize your online store's performance.
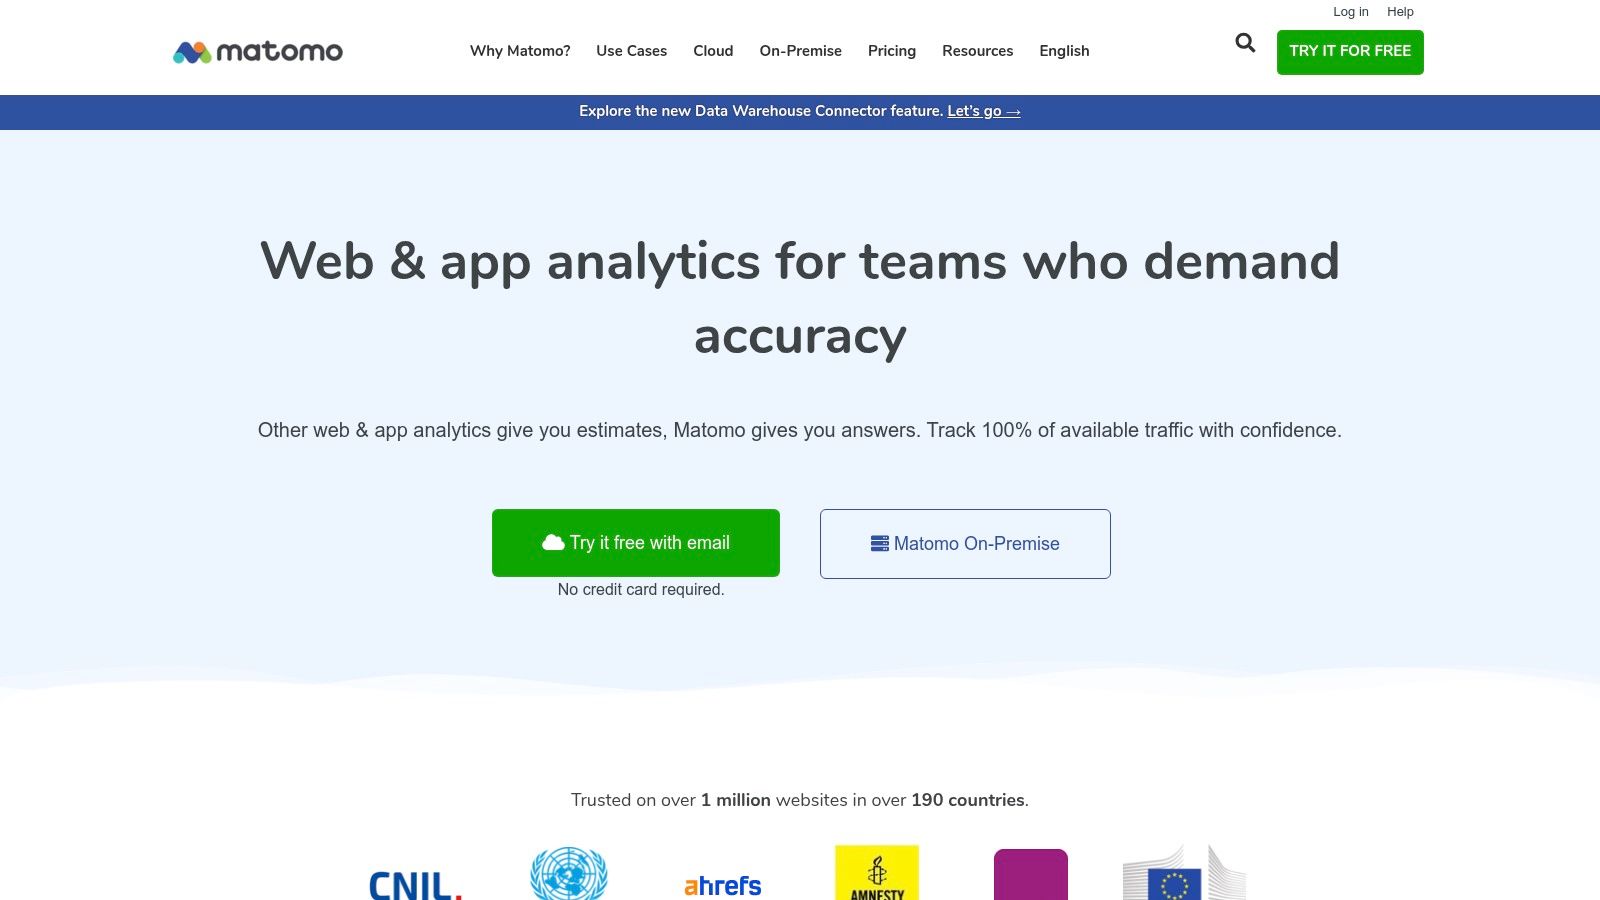
Core Features & Use Cases
Matomo goes beyond standard traffic metrics by integrating qualitative analytics tools directly into its platform. Features like heatmaps and session recordings allow you to visually understand where users click, scroll, and encounter friction. You can also run A/B tests to optimize product pages or checkout flows. For eCommerce, this means you can track detailed conversion funnels, identify drop-off points, and gain insights into user behavior without ever sending your customer data to a third-party server.
Practical Tip: Use the session recording feature to watch users who abandoned their carts. This can reveal usability issues, confusing shipping options, or technical glitches that a standard analytics report would miss.
Limitations and Considerations
The biggest consideration with Matomo is its hosting. You must either self-host it on your own servers, which requires technical expertise for setup and maintenance, or use their paid cloud service. While the interface is robust, some users may find it less polished or intuitive than more mainstream solutions. Because it’s not as widely used as Google Analytics, finding pre-built integrations for niche marketing tools can sometimes be a challenge. However, for privacy-conscious brands, these trade-offs are often worthwhile.
- Best For: eCommerce businesses prioritizing data ownership and privacy compliance.
- Pricing: Free for the self-hosted version (On-Premise); paid plans for the cloud-hosted version start based on traffic.
- Website: https://matomo.org
5. Woopra
Woopra shifts the focus from aggregated website traffic to the individual customer journey. It’s a powerful customer journey analytics platform that excels at creating unified profiles for each user, tracking their interactions across every touchpoint, from initial website visit to support tickets and email engagement. This detailed, person-centric view makes Woopra one of the more insightful ecommerce analytics tools for understanding long-term customer behavior.
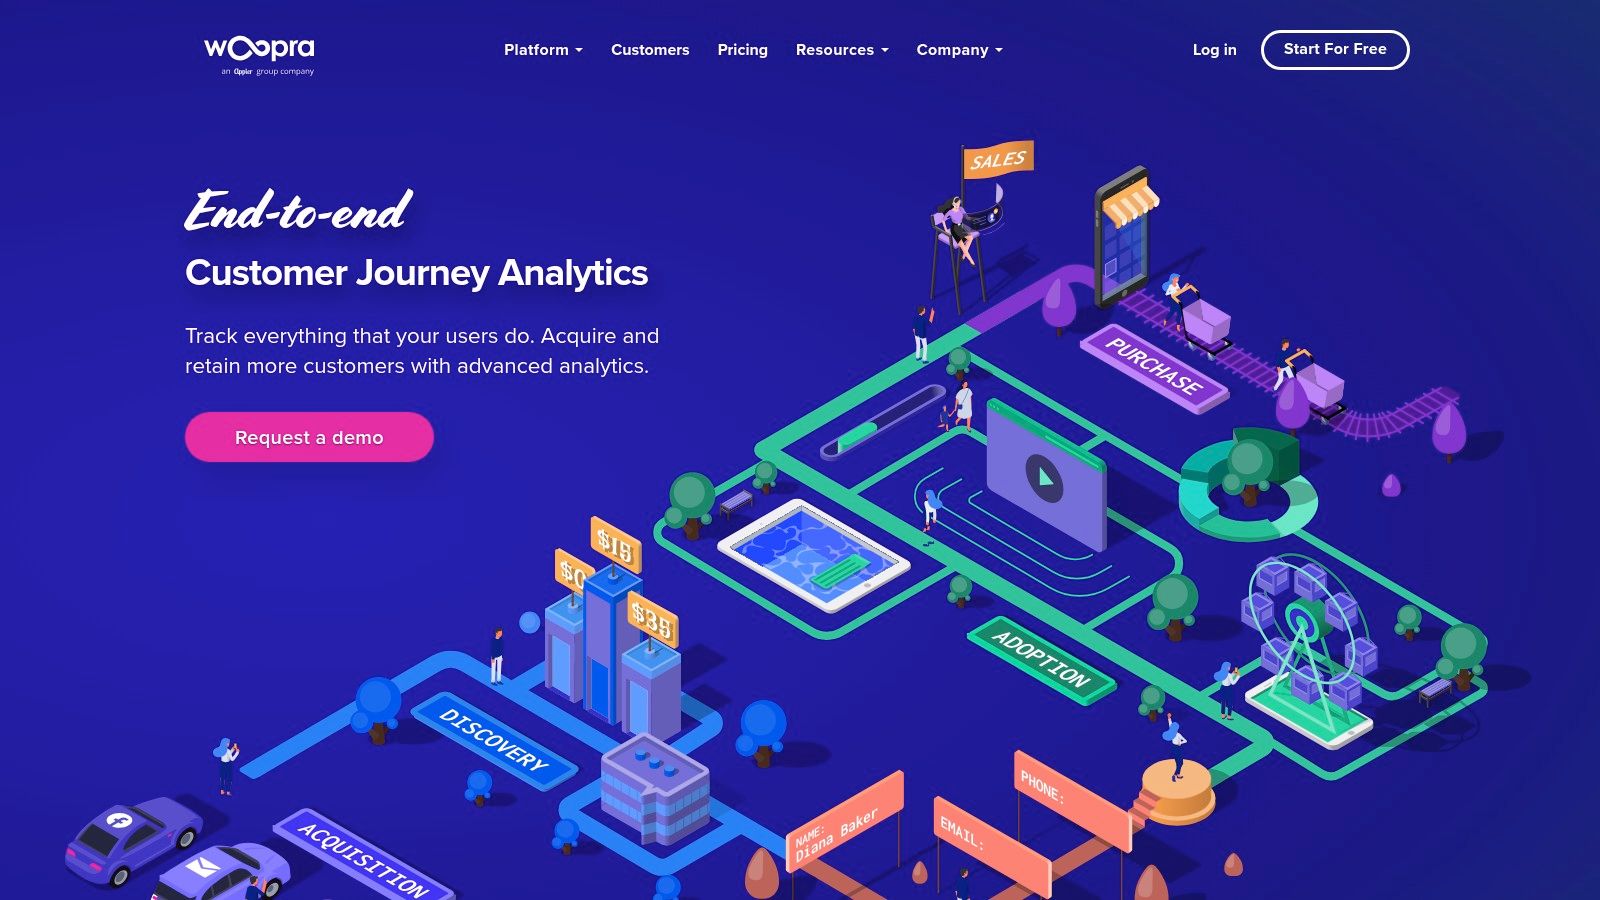
Core Features & Use Cases
Woopra's standout feature is its real-time journey mapping. You can visualize how specific customer segments navigate your site, identifying patterns that lead to high average order values or, conversely, to churn. Its behavioral segmentation allows you to group users based on their actions, like "viewed 3+ products but didn't add to cart" or "made 2+ purchases in 30 days." A key advantage is its ability to trigger automated actions; for example, you can send a targeted discount via a marketing integration to a user who shows signs of cart abandonment.
Practical Tip: Create a "High-Value Customer" segment based on total spend and purchase frequency. Set up a trigger to notify your customer service team via Slack whenever a user in this segment submits a support ticket, enabling a priority response.
Limitations and Considerations
Woopra’s depth comes at a price, and its subscription costs can be significantly higher than many other analytics tools, making it less accessible for businesses on a tight budget. While it offers a range of integrations, its library is not as extensive as some larger platforms, which may require custom development for connecting with more niche or proprietary systems. The platform's focus on individual journeys means it is less suited for high-level, aggregated traffic analysis where tools like Google Analytics might be preferred.
- Best For: Subscription-based or high-consideration eCommerce businesses focused on customer lifetime value and retention.
- Pricing: Starts with a Free plan for basic tracking. Paid plans (Startup, Pro, Enterprise) are based on the number of actions tracked per month.
- Website: https://www.woopra.com
6. Crazy Egg
Crazy Egg moves beyond traditional tables and charts to provide visual insights into how users interact with your website. It specializes in heatmaps, scrollmaps, and session recordings, making it an indispensable tool for understanding the "why" behind your quantitative data. For eCommerce stores, this means you can literally see where customers are clicking, how far they scroll on product pages, and what elements they ignore, offering a clear path to UX improvements.
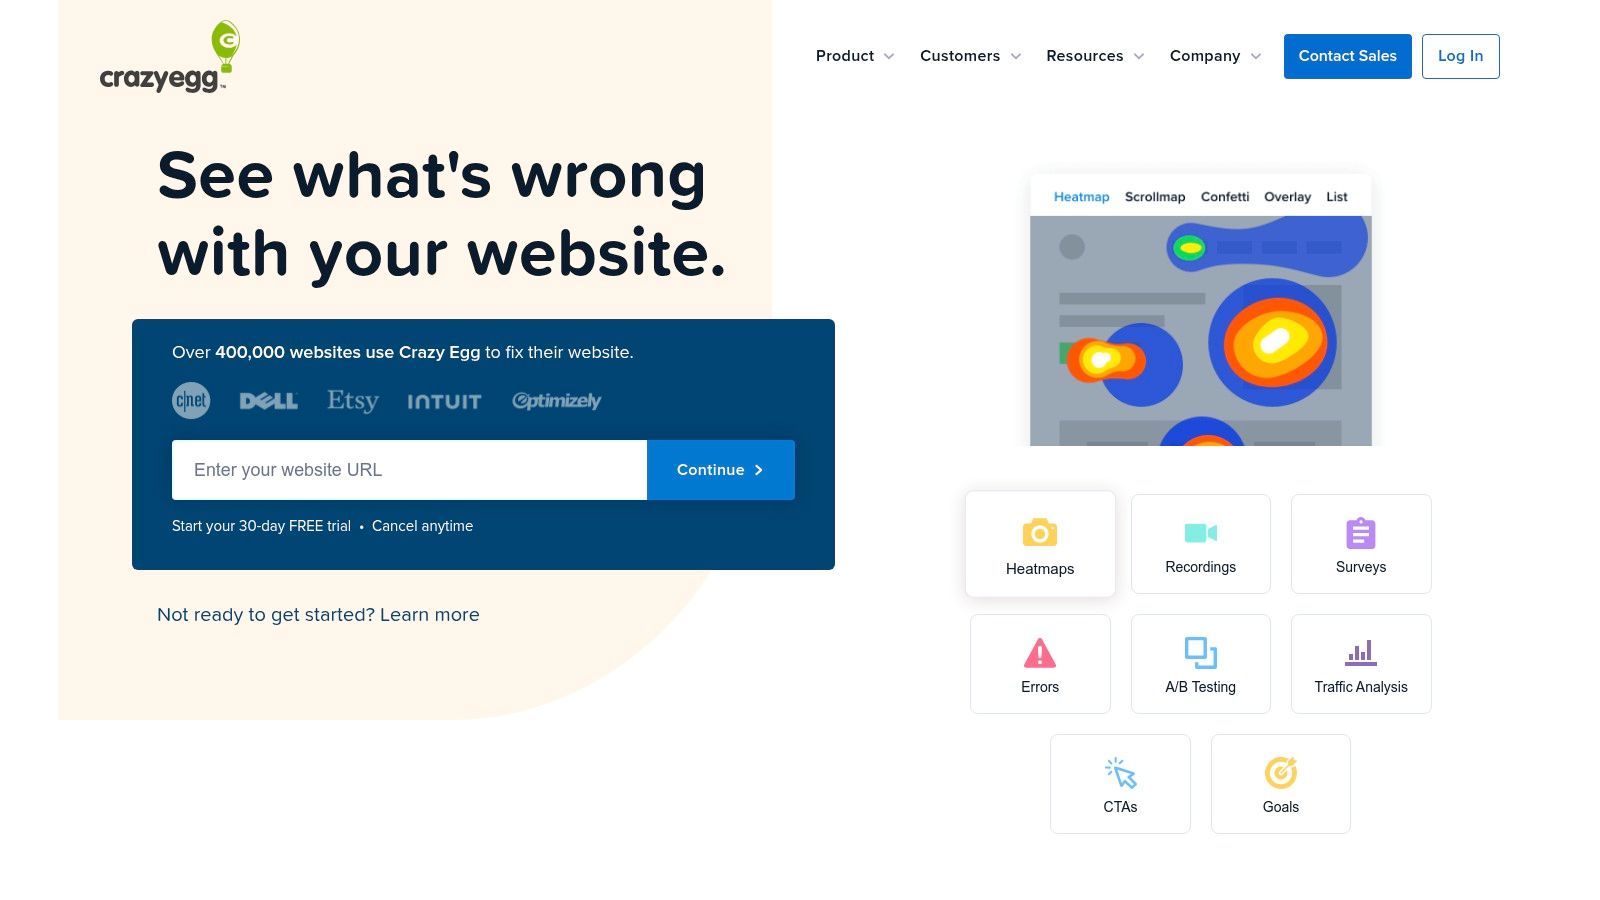
Core Features & Use Cases
The primary strength of Crazy Egg lies in its visual reports. Heatmaps show you the most popular (and unpopular) areas of a page, helping you optimize the placement of "Add to Cart" buttons, promotional banners, and trust badges. Scrollmaps reveal how far down the page users go, which is critical for ensuring they see key product details or shipping information. The platform also includes A/B testing, allowing you to act on your heatmap insights immediately by testing new layouts or button colors to see what drives more conversions.
Practical Tip: Use the "Confetti" report to segment clicks by traffic source. This can reveal if visitors from Facebook are interacting with your landing page differently than those from Google Search, allowing you to tailor page experiences for different audiences.
Limitations and Considerations
While excellent for visual, on-page analysis, Crazy Egg is not a comprehensive analytics suite. It doesn't track complex sales funnels or attribution in the same way Google Analytics does; it focuses strictly on user behavior on a given page. The platform also lacks real-time data, with reports sometimes taking a few hours to update. It is best used as a supplementary tool alongside another quantitative platform to provide context to your core metrics, making it a powerful part of a broader ecommerce analytics tools strategy.
- Best For: eCommerce marketers and UX designers focused on optimizing on-page conversions and user experience.
- Pricing: Plans start from $29/month, scaling based on tracked pageviews and features. A free trial is available.
- Website: https://www.crazyegg.com
7. Hotjar
While quantitative tools tell you what is happening on your site, Hotjar tells you why. It’s a leading behavior analytics platform that provides visual, qualitative insights into how users interact with your eCommerce store. By moving beyond numbers and charts, Hotjar helps you empathize with your customers, making it one of the most powerful complementary ecommerce analytics tools for optimizing user experience (UX) and conversion rates.
Core Features & Use Cases
Hotjar's suite is built around understanding user behavior. Heatmaps visually aggregate clicks, moves, and scrolls, showing you which parts of a product page attract the most attention and which are ignored. Session recordings provide video-like playbacks of individual user journeys, allowing you to see exactly where they get stuck or confused during checkout. You can also deploy on-site surveys and feedback polls to ask customers directly about their experience or why they are abandoning their cart.
Practical Tip: Use session recordings to watch users who added items to their cart but did not complete the purchase. This can reveal hidden usability issues, confusing shipping options, or technical bugs in your checkout process that hard data alone would miss.
Limitations and Considerations
Hotjar’s strength is its qualitative focus, not its quantitative depth, so it isn't a replacement for a tool like Google Analytics. Its integrations with other platforms are more limited compared to some larger analytics suites. On its free and lower-tier plans, data storage and the number of sessions you can record are capped, which can be restrictive for high-traffic stores. To get the most value, you must actively watch recordings and analyze heatmaps, requiring a time investment.
- Best For: eCommerce teams focused on UX optimization and understanding the "why" behind their quantitative data.
- Pricing: Offers a free plan with limited sessions. Paid plans scale based on session volume, starting from $32/month.
- Website: https://www.hotjar.com
8. Kissmetrics
Kissmetrics shifts the analytics focus from tracking page views to tracking people. It is a powerful conversion optimization platform designed to give eCommerce businesses deep insights into individual user behavior. Instead of just showing you what happened on your site, Kissmetrics tells you who did it, making it one of the most person-centric ecommerce analytics tools available for understanding the entire customer lifecycle.
Core Features & Use Cases
The platform excels at funnel and cohort analysis. You can build detailed funnels to see exactly where users drop off between signing up and making a purchase, or track the long-term value of customers acquired from a specific marketing campaign. Its strength lies in tying every action back to a real user profile, allowing you to see a person’s complete journey across multiple sessions and devices. The built-in A/B testing feature lets you act on these insights directly within the platform, testing changes to improve conversion rates.
Practical Tip: Use the Cohort Report to compare the behavior of users who first visited during a Black Friday sale versus those who came from a Q2 content marketing campaign. This helps you understand which acquisition channels bring in the most valuable long-term customers.
Limitations and Considerations
Kissmetrics is a premium tool, and its pricing can be a significant investment for smaller businesses, making it more suitable for established brands focused on optimization. While it provides incredibly deep historical data, its real-time reporting capabilities can be less immediate than some other platforms. Its interface is designed for marketers focused on conversion, which means it may lack some of the broader, top-level traffic metrics that general-purpose analytics tools provide.
- Best For: Established eCommerce businesses focused on deep user journey analysis and conversion rate optimization.
- Pricing: Starts at $299/month for SMBs, with higher tiers for larger businesses and custom enterprise plans.
- Website: https://www.kissmetrics.io
9. Adobe Analytics
Adobe Analytics is an enterprise-grade solution that offers some of the most powerful and granular customer journey analysis on the market. Part of the Adobe Experience Cloud, it moves beyond standard web traffic metrics to provide a holistic view of the customer across every touchpoint, from web and mobile apps to offline interactions. Its strength lies in its ability to process massive datasets in real-time and provide sophisticated segmentation capabilities, making it a go-to choice among top-tier ecommerce analytics tools for large, data-driven organizations.
Core Features & Use Cases
The platform excels at advanced segmentation and audience building. You can create highly specific user segments based on an almost limitless combination of behaviors, attributes, and events, then analyze their unique paths to purchase. Its predictive analytics features, powered by Adobe Sensei AI, can forecast customer churn, predict conversion likelihood, and identify anomalies in your data automatically. This allows marketing teams to proactively target at-risk customers or double down on high-value segments with personalized campaigns.
Practical Tip: Use the "Analysis Workspace" to drag and drop different data dimensions, metrics, and segments to create custom, shareable dashboards. This is perfect for building a real-time "mission control" for your marketing team to monitor campaign performance and key business KPIs.
Limitations and Considerations
The biggest hurdles for most businesses are the significant cost and steep learning curve associated with Adobe Analytics. It requires dedicated, trained analysts to extract its full value, making it less suitable for smaller teams without specialized resources. While its integration within the Adobe ecosystem is a major advantage, connecting it with non-Adobe tools can be more complex than with more open platforms. Its power is often overkill for businesses that don't have the data volume or analytical maturity to leverage its advanced features.
- Best For: Large enterprises and mature eCommerce businesses that require deep, cross-channel customer intelligence and are already invested in the Adobe ecosystem.
- Pricing: Available by custom quote only; generally considered one of the more expensive options on the market.
- Website: https://www.adobe.com/analytics
10. Supermetrics
Supermetrics isn't a traditional analytics dashboard but rather a powerful data connector that acts as the essential plumbing for your marketing reports. It excels at pulling scattered data from dozens of advertising platforms, social media channels, and other marketing tools directly into your preferred reporting environment, like Google Sheets, Looker Studio (formerly Data Studio), or Excel. For eCommerce businesses juggling multiple ad channels, this automation eliminates the tedious and error-prone task of manual data collection, making it one of the most vital ecommerce analytics tools for creating a unified view of performance.
Core Features & Use Cases
The primary use case for Supermetrics is consolidating your marketing spend and performance data into a single, cohesive dashboard. An eCommerce store running campaigns on Facebook Ads, Google Ads, TikTok, and Pinterest can use Supermetrics to automatically pull metrics like impressions, clicks, cost, and conversions from each platform into one Google Sheet. This enables you to calculate blended Cost Per Acquisition (CPA) and total Return on Ad Spend (ROAS) without logging into four different accounts. Its automated data transfers can be scheduled to run daily or even hourly, ensuring your reports are always up-to-date.
Practical Tip: Create a master marketing dashboard in Looker Studio. Use Supermetrics connectors to pull data from all your paid channels. Blend this data to visualize your total ad spend versus total revenue (pulled from your Shopify or GA4 connector) for a real-time profitability overview.
Limitations and Considerations
Supermetrics is a data pipeline, not a visualization tool. To get the most out of it, you need to be comfortable working within spreadsheet or BI platforms like Looker Studio. Its pricing is based on the number of data sources and user accounts, which can become costly for smaller businesses or agencies managing many clients. While it solves the data collection problem brilliantly, the responsibility of analyzing and interpreting that data still falls on you and your team.
- Best For: eCommerce businesses with multi-channel marketing strategies that need to consolidate reporting.
- Pricing: Varies by destination (e.g., Looker Studio, Google Sheets) and number of data sources, starting from around $49/month.
- Website: https://supermetrics.com
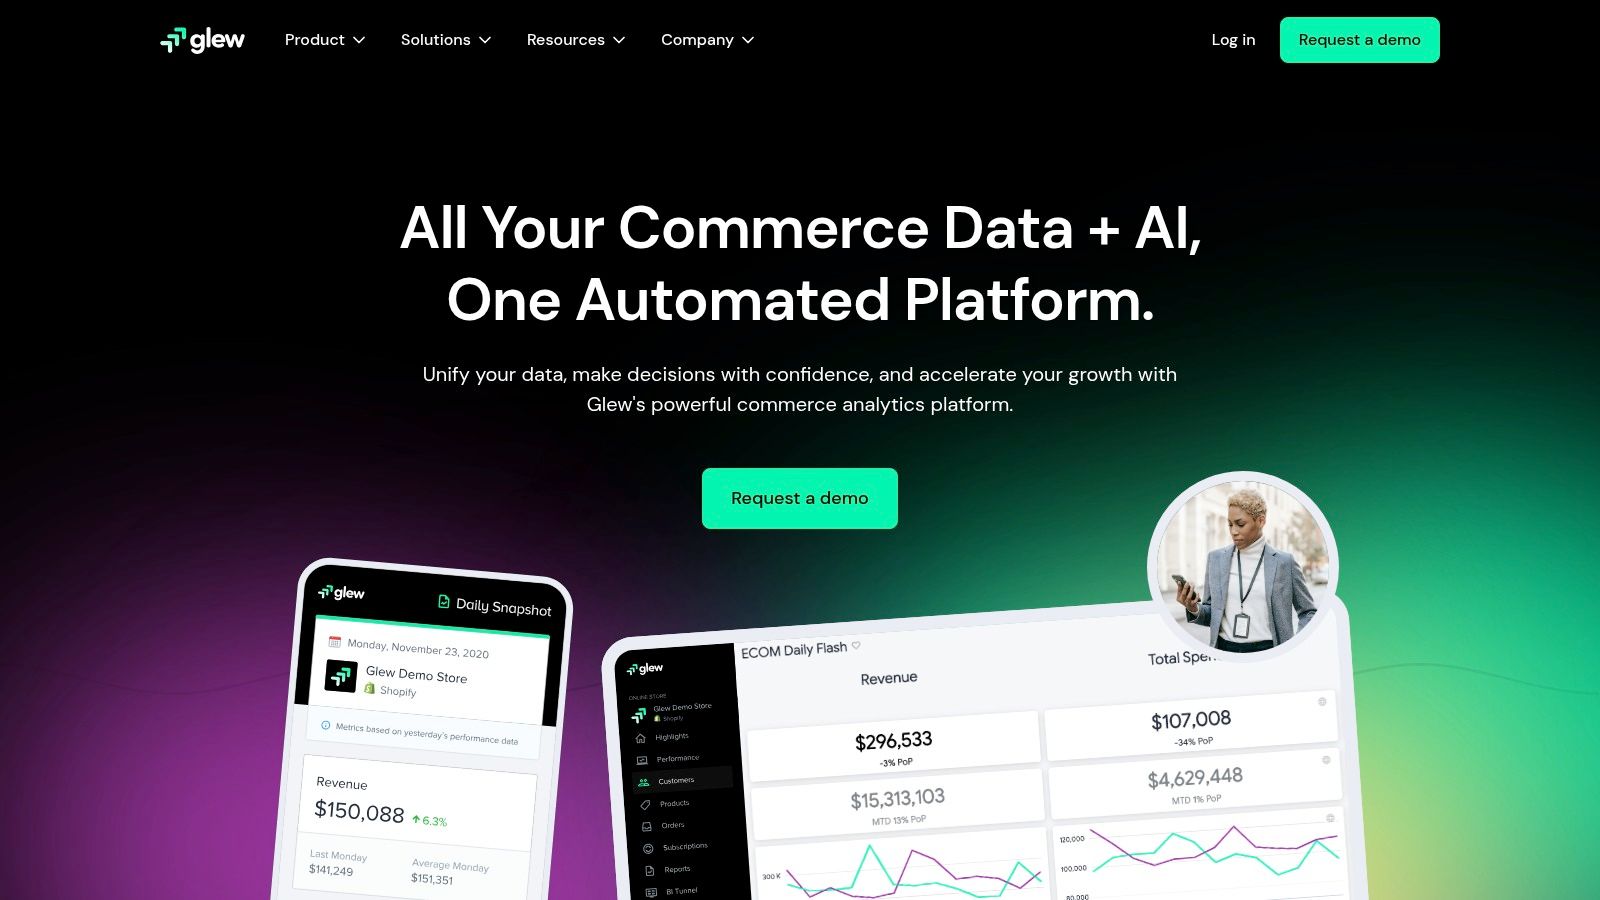
11. Glew.io
Glew.io is an ecommerce-specific business intelligence (BI) platform that goes beyond standard analytics by consolidating data from your store, marketing channels, and subscriptions into one unified dashboard. It’s designed to provide a holistic view of business performance, helping you connect the dots between marketing spend, customer lifetime value, and product profitability, making it one of the more robust ecommerce analytics tools for scaling businesses.
Core Features & Use Cases
Glew.io excels at multichannel analytics, pulling data from sources like Shopify, Google Ads, Facebook Ads, and Klaviyo to create comprehensive reports. This allows you to accurately measure cross-channel performance and attribute revenue correctly. Its customer segmentation capabilities are powerful, enabling you to identify your most valuable customer cohorts based on LTV, purchase frequency, or AOV. These insights are critical for optimizing retention marketing and personalizing campaigns. It also offers advanced inventory and product analytics to prevent stockouts and identify your best- and worst-selling items.
Practical Tip: Use Glew's "Customer Segments" report to build a "high-LTV, at-risk of churn" segment. You can then export this list to your email platform and target them with a specific win-back campaign to protect future revenue.
Limitations and Considerations
While Glew.io offers immense depth, its pricing structure can be a significant investment, making it less accessible for early-stage startups or small businesses. The platform is data-rich, which means some of its more advanced reporting features can present a learning curve for users without a strong analytics background. For businesses interested in forecasting future trends, learning how to leverage predictive analytics for eCommerce can help maximize the value derived from a powerful tool like Glew.
- Best For: Established eCommerce brands that need to consolidate data from multiple sources and gain deeper insights into profitability and customer behavior.
- Pricing: Starts with Glew Pro at $79/month, with custom pricing for Glew Plus and enterprise-level plans.
- Website: https://glew.io
12. Triple Whale
Triple Whale positions itself as the central operating system for Shopify brands, moving beyond traditional analytics to offer a unified, real-time view of your entire eCommerce operation. It aggregates data from all your essential platforms - like Shopify, Facebook Ads, Google Ads, Klaviyo, and TikTok - into a single, cohesive dashboard. This makes it one of the most powerful ecommerce analytics tools for brands that are tired of juggling multiple tabs to understand their performance.
Core Features & Use Cases
The platform's strength is its ability to provide a clear, accurate picture of your blended ROAS (Return on Ad Spend) and MER (Marketing Efficiency Ratio). By integrating with your ad platforms and store, it solves common attribution challenges, giving you a reliable source of truth for marketing performance. Its customizable dashboards allow you to track the metrics that matter most to your business in real-time, from creative-level ad performance to lifetime value (LTV) and profit tracking. The AI-driven insights feature, "Whale AI," can answer plain-language questions about your data, like "Which product had the highest profit last month?"
Practical Tip: Use the "Creative Cockpit" feature to analyze the performance of individual ad creatives across all platforms. This helps you quickly identify winning ads and allocate your budget more effectively, rather than relying on platform-specific data alone.
Limitations and Considerations
Triple Whale's primary limitation is its exclusivity to the Shopify ecosystem; it is not available for stores on other platforms like BigCommerce or WooCommerce. The pricing, which scales with revenue, can also be a significant investment for smaller or early-stage businesses. While incredibly powerful, its deep focus on marketing attribution and finance means it might not replace tools specifically designed for deep on-site behavioral analysis or CRO experimentation.
- Best For: High-growth Shopify brands that are heavily invested in paid advertising across multiple channels.
- Pricing: Starts at $129/month, with pricing tiers based on your store's annual revenue.
- Website: https://www.triplewhale.com
Ecommerce Analytics Tools Comparison
Choosing Your Analytics Partner: From Data to Decisions
Navigating the landscape of ecommerce analytics tools can feel overwhelming, but making an informed choice is a pivotal step toward transforming raw data into revenue-driving decisions. Throughout this guide, we've explored a diverse array of platforms, from foundational tools like Google Analytics and Shopify Analytics to specialized behavior-tracking software like Hotjar and Crazy Egg, and powerful, enterprise-grade solutions such as Adobe Analytics and Triple Whale. The central lesson is clear: there is no single "best" tool for every business. The right solution is the one that aligns with your unique circumstances.
The journey from data collection to actionable insight is a multi-stage process. Your choice of tool should mirror your current position on that journey. A new store on Shopify, for example, can gain immense value by mastering its native analytics and supplementing it with a visual tool like Crazy Egg to understand why users are behaving a certain way. As your business scales and complexity grows, your needs will evolve, making platforms like Mixpanel or Glew.io more attractive for their deep, granular analysis of customer cohorts and lifetime value.
Key Factors to Guide Your Selection
Making the right choice requires a strategic internal audit. Before committing to a platform, consider these critical factors:
- Business Stage and Scale: An emerging brand has different needs than an established enterprise. Don't over-invest in a complex tool if your team lacks the resources to manage it. Start with what you can realistically implement and master.
- Technical Resources: Who will be responsible for implementation and maintenance? Some tools, like Google Analytics 4, require significant setup and ongoing management. Others, like Shopify Analytics, are ready out of the box. Be honest about your team's technical capabilities or your budget for hiring external help.
- Strategic Goals: What specific questions are you trying to answer? If your focus is on improving user experience and on-page conversions, behavioral analytics tools are essential. If you need to understand customer lifetime value and product profitability, a platform like Glew.io is more suitable.
- Budget: Costs can range from free to thousands of dollars per month. Define a clear budget, but also consider the potential return on investment. The right tool, used effectively, should pay for itself many times over by identifying optimization opportunities and preventing costly mistakes.
Beyond the Tool: The Importance of Strategy and Execution
It's a common pitfall for brands to become data-rich but insight-poor. Investing in powerful ecommerce analytics tools is only the first step. The true value is unlocked when you can consistently translate that data into concrete actions, such as A/B testing a new checkout flow, personalizing marketing campaigns, or optimizing your product merchandising strategy.
This is where expertise becomes a critical bottleneck for many growing businesses. You may have all the data in the world from Mixpanel or Kissmetrics, but if you lack the time, a dedicated analyst, or the CRO expertise to interpret it and execute changes, that data remains dormant. The most successful ecommerce brands understand that analytics is not just a reporting function; it is the engine of an iterative growth cycle.
Remember, the ultimate goal isn't just to track metrics; it's to influence them. Your chosen analytics stack should empower you to build better customer experiences, make smarter marketing investments, and foster sustainable, profitable growth. View your analytics platform not as a simple software subscription, but as a strategic partner in your brand’s long-term success story.
Overwhelmed by data or unsure how to turn your analytics into action? The expert team at ECORN specializes in helping ecommerce brands harness the power of their data. We provide strategic CRO, development, and consulting services to transform insights from your tools into measurable revenue growth. Let's build a smarter growth strategy for your brand together.


Master How to Improve Email Deliverability in 2026

Top 7 eCommerce Partners NYC for Shopify Brands in 2026
Machine Learning for Ecommerce: Boost Your Shopify Store

Beauty Market Research: Your 2026 Growth Guide

Shopify International Expansion: A 2026 Roadmap
What Does CRO Stand for in Business: Understanding CRO

Shopify Visual Merchandising: A Playbook for Higher Sales

Shopify Landing Page Design: Master Conversion in 2026
10 Best AI SEO Optimization Tools for Shopify in 2026

Agentic AI for Ecommerce: Boost Your Sales in 2026
Mastering Email Marketing Data for eCommerce Growth
Conversion Rate Optimisation Australia: Boost Your Sales
Conversion Rate Optimization AI: Your Shopify Store Guide

10 Product Bundling Strategies for Shopify in 2026
How to Increase Customer Lifetime Value: A Shopify Playbook
AI Customer Service Automation: Shopify Guide 2026
Clean Website Design: A Shopify Conversion Playbook

Omnichannel Retail Strategy: A Shopify Playbook
Product Data Enrichment: A Guide for Shopify Brands
Instagram Shopping Features a Guide for Shopify Stores
What Is Revenue Optimization: A Holistic RevOps Guide
Benefits of Conversion Rate Optimization: Boost Your
WordPress to Shopify Migration: Your 2026 Seamless Switch
Boost Sales: Ecommerce Payment Processing Guide 2026
Unified Commerce Platform: Benefits, KPIs & Shopify Guide
How to Reduce Bounce Rate eCommerce: Your 2026 Guide
Shopify API Integration: A Practical End-to-End Guide

How to Implement Data Governance: A 2026 Guide

Shopify Store Development Cost: A 2026 Breakdown
What Is Server Side Tracking: The Shopify Guide 2026
Marketing Automation Workflows: A Shopify Guide for 2026

Shopify: How to Reduce Technical Debt

Shopify UX Design Change: A Playbook for Growth
User Generated Content Strategy: Shopify Playbook

Shopify Pause and Build Plan Cost: A Complete 2026 Guide
Compare at Price on Shopify: A Complete Guide for 2026

Where Can I Sell My Prints? 10 Best Platforms for 2026
Shopify Order Management System: The Ultimate Guide 2026
What Is Marketing Attribution? an eCommerce Guide for 2026

10 Best Black Friday Sales Sheets for 2026

Discover the Top Social Media Marketing Agencies For

Consumer Confidence Definition for eCommerce in 2026

What Is Social Commerce? Your 2026 Guide to Boosting Sales

A Social Ad Campaign Playbook for eCommerce Growth

7 Best FAQ Page Examples for SaaS & eCommerce

Market Research in Fashion Industry: A Guide for Shopify

Shopify Migration Services: Expert Guide for 2026

Mastering FB Retargeting Ads for Shopify in 2026
What Is Omnichannel Ecommerce

Master Your Shopify Plus Migration: The 2026 Guide
Shopify Integration Services: A Merchant's 2026 Guide
Shopify Collection Description: A Guide to SEO & Sales
Shopify Plus Contact: Reach Sales & Support Effectively

Top Luxury Shopify Stores: Design & UX Strategies
How to Improve Customer Experience: A Shopify Roadmap

Creative Facebook Ads: 10 Examples for Shopify Brands

Remarketing with Facebook Ads: A Shopify Guide for 2026

SEO Linking Strategies for Shopify Stores
Top 7 Statistics YouTube Channels for eCommerce in 2026

Hiring Shopify Plus Designers: A Founder's Guide

Shopify Product Variation: Master Your Variants for 2026

Leverage Ai Solutions Brands: Your 2026 Shopify Growth Guide

Filters in Shopify: A Guide for Growing Brands

Shopify Plus Developer: A Guide for Growing Brands

When Does Black Friday Online Start? A 2026 Guide
Black Friday Email Marketing: Shopify & Klaviyo Guide

Polaris Design System: The Complete Shopify Guide

How to Hire a Consultant Email Marketing Expert

What Is Q4? A Shopify Merchant's Guide to Peak Season

Marketing Organization Structure for eCommerce Growth

Top Account-Based Marketing Agency Guide for 2026

7 Remarketing Ad Examples for Your 2026 Campaigns

AI Retail Solutions: Boost Your Shopify Store

Migrate to Shopify: The Definitive 2026 Guide

Shopify Authentication App: A Guide for Secure Stores

Why Strategic Marketing Is Important for Growth in 2026

How to Create a Size Chart in Shopify: 2026 Guide

Shopify Themes for Jewelry: The Definitive 2026 Guide

Minimal Shopify Templates: Faster, Higher-Converting Stores
Maximize Profit: Shopify CC Fees 2026 Guide

Best Shopify Apps for Beginners in 2026

How to Improve Online Shopping Experience in 2026

Shopify Design and Development Services: A 2026 Guide

Small Business Social Media Marketing Agency: A Hiring Guide

Bulk Edit Shopify: A Guide to Save Hours on Store Updates

2026 Trends in Food and Beverage Industry

Post Purchase Survey Guide for Shopify Stores

How to Build an Ecommerce Brand in 2026
Conversion Rate Optimization for Ecommerce: Maximize Profit
How to Use Customer Data to Increase Sales: A Guide

Shopify for Enterprise: The 2026 Deep Dive Guide

Email Marketing Agencies: The Guide for Shopify Brands
Boost Sales With The Right Shipping Shopify App

Your Guide to the Shopify Site Map

7 Headless Commerce Examples for 2026

Mastering Trends in Cosmetic Industry for 2026

Transfer Shopify to BigCommerce The Complete 2026 Playbook

What Is Shopify Collective? Your 2026 Guide to Success

Unlock Shopify Growth with Site Link SEO

Integrating Shopify and WordPress A Complete Guide for 2026


newsletter in your inbox