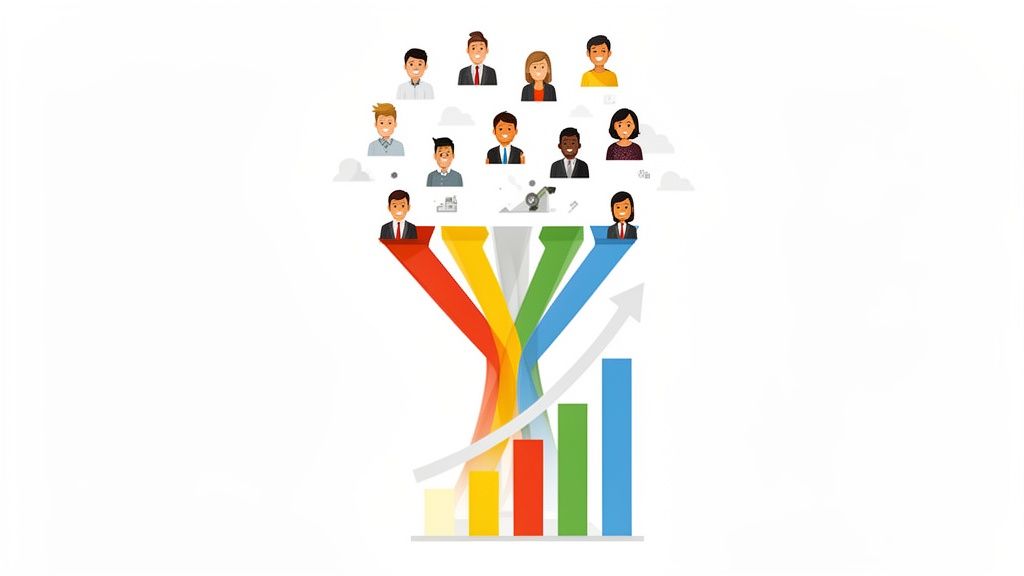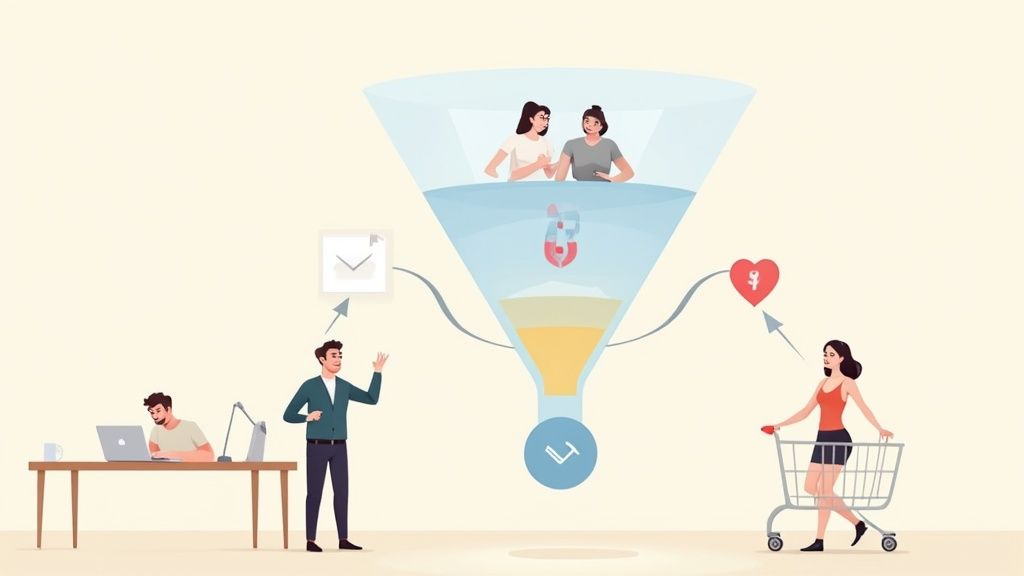
Let's be honest, "conversion funnel analysis" sounds a bit jargony. But all it really means is mapping out the path a customer takes from the first time they hear about you to the moment they click "buy." It's about looking at each step in that journey to see where people are getting stuck or dropping off.
When you do this right, you can pinpoint the exact spots where you're losing money and optimize the entire journey for a much better outcome.
Your Guide to Understanding the Customer Journey
Forget the textbook definitions for a minute. A conversion funnel isn't just a simple A-to-B path. It's really a series of small commitments a person makes with your brand. By getting a handle on conversion funnel analysis, you're essentially turning a pile of data into a strategic roadmap. It shows you exactly where the leaks are in your revenue stream and gives you the tools to patch them up.
This isn't just about abstract numbers; it’s about watching how real people interact with your site, your ads, and your products. The whole point is to turn those observations into a better user experience, which, in the end, drives real growth for your business.
The Classic Funnel Stages, Reimagined for Today
The old-school AIDA model (Awareness, Interest, Desire, Action) is a decent starting point, but it plays out differently in the digital space. More importantly, every type of business has its own unique customer flow.
For an E-commerce store: The journey might start with a social media ad (Awareness). From there, a user browses a few product categories (Interest), adds an item to their cart (Desire), and finally, completes the checkout (Action). That drop-off between adding to the cart and actually paying? That's a classic, high-value leak you need to investigate.
For a SaaS company: A user might find you through a helpful blog post (Awareness). Then they sign up for a webinar (Interest), start a free trial (Desire), and ultimately upgrade to a paid subscription (Action). That moment they switch from a free trial to a paid plan is the most critical conversion point you have.
For Lead Generation: A potential client could land on your site from a Google search (Awareness). They might download a whitepaper (Interest), and then fill out a contact form to talk to your sales team (Action). In this case, the form submission is the main prize.
Why This Perspective Matters
Looking at the funnel through the lens of your specific business model is a game-changer. It forces you to stop thinking in generic terms and start focusing on the actual, measurable steps your users are taking. This is where the real analysis happens.
The true power of conversion funnel analysis isn't just knowing that 70% of users abandoned their cart. It’s discovering the why—like finding out a confusing shipping calculator was scaring them away.
This level of detail lets you make precise, high-impact changes instead of just throwing things at the wall and hoping something sticks. To really nail the customer journey, you have to think about it from the very beginning, especially when you're crafting something like a new product launch strategy. By mapping out the intended journey from day one, you build a much stronger foundation for success and turn your data into a repeatable engine for growth.
Laying the Groundwork for a Killer Funnel Analysis
Before you can start pulling out game-changing insights, you need a solid foundation. Think of this as your pre-flight checklist. Skipping these early steps is like trying to navigate a new city without a map—you'll just end up lost in a sea of numbers, chasing ghosts and drawing all the wrong conclusions.
Getting this part right ensures every piece of data you look at is clean, accurate, and trustworthy. This is the only way to build an analysis that actually leads to business growth, not just more spreadsheets.
Choosing Your Core Analytics Tools
The market is flooded with powerful tools, but you really don't need all of them. The trick is to pick the ones that align with your business model and what you're actually trying to measure. From my experience, combining a quantitative tool with a qualitative one gives you the most complete picture.
Here’s a quick rundown of some of the heavy hitters to get you started.
Essential Tools for Conversion Funnel Analysis
Picking the right tool isn't about the one with the most bells and whistles. It’s about finding the one that best answers your specific business questions. An e-commerce store, for instance, will get massive value from Hotjar's heatmaps on product pages. On the other hand, a SaaS business will practically live inside Mixpanel to see how users are engaging with their free trial.
The goal here is clarity. You want a toolset that speaks your business's language and directly addresses the questions keeping you up at night.
Defining Clear and Measurable Goals
With your tools ready to go, the next job is to define what success actually looks like at each stage of your funnel. Vague goals like "get more signups" are completely useless for a real analysis. You need specific, measurable targets that leave zero room for interpretation.
This means turning those fuzzy objectives into concrete key performance indicators (KPIs). Instead of a weak goal like "improve the checkout process," you need something sharp: "reduce cart abandonment rate from 45% to 35% in Q3." Now you have a clear benchmark for success.
For an e-commerce funnel, your goals might look something like this:
- Hit a 10% click-through rate from the homepage hero banner to a product category page.
- Get a 5% conversion rate from product page view to the "Add to Cart" click.
- Keep the drop-off rate below 20% between the shipping and payment steps.
Setting precise goals is hands-down the most critical part of this setup. Without them, you’re just collecting data for the sake of it. You'll have no real way to tell if your hard work is actually paying off.
Implementing Flawless Event Tracking
Now for the final technical piece: event tracking. This is non-negotiable. Event tracking is how you tell your analytics platform which user actions actually matter to your business. If your tracking is sloppy or incomplete, your entire analysis will be built on a house of cards.
An event can be anything from a button click to a form submission or a video play. You'd set up an event to fire every single time someone clicks "Request a Demo" or completes a purchase. It’s that granular.
This screenshot from Google Analytics 4 shows what this looks like in practice. It's a Funnel exploration report, which perfectly visualizes how people move through the steps you've defined.

You can see immediately where the biggest leaks are, which tells you exactly where to focus your energy. Proper event tracking is what powers these essential reports and turns raw data into a real action plan.
How to Perform a Conversion Funnel Analysis
Alright, you've got your tools set up and tracking is live. Now comes the fun part: digging into the data. This is where you stop preparing and start acting, turning all those raw numbers into a clear story about how customers actually move through your site.
Think of a conversion funnel analysis less like a search for a single magic fix and more like a systematic investigation. You're becoming a detective, looking for clues at each stage of the customer journey. This methodical approach is what lets you find the real problems and make targeted improvements that actually work.
Map Your Unique User Journey
Before you can spot where things are going wrong, you have to define what "right" looks like. Every business is different, so a generic funnel template just won't cut it. You need to map out the specific, critical path you expect your users to take.
For a standard Shopify store, that path usually looks something like this:
- Homepage Visit: The first handshake.
- Product Page View: They’re leaning in, showing interest in an item.
- Add to Cart: A strong signal of intent to buy.
- Initiate Checkout: They're heading for the finish line.
- Purchase Complete: The conversion goal is met.
This map is the skeleton of your entire analysis. It’s your baseline, the ideal path you'll measure everything against. Without it, you’re just staring at data with no context.
Master the Art of Data Segmentation
Looking at all your users in one giant bucket will give you a blurry, unhelpful picture. The real "aha!" moments happen when you start slicing that data into smaller, more focused groups. This is data segmentation, and it's where the hidden stories are.
By filtering your audience based on shared traits, you can see how different groups behave. You'll quickly find out who is converting and, more importantly, who is bailing and why.
Key Segments to Analyze
- By Traffic Source: How do users from organic search, paid ads, social media, and email compare? Maybe you'll find that visitors from an Instagram campaign have a massive drop-off on product pages. This is a classic sign of a mismatch between your ad creative and the product itself.
- By Device: Pit desktop users against mobile users. Is there a huge drop-off for mobile users once they hit the checkout page? That’s a massive red flag that your mobile checkout experience is likely broken or frustrating.
- By User Type: How do new visitors behave compared to returning ones? If returning visitors convert at a much higher rate, you might need to work on building trust and making a stronger first impression for newcomers.
- By Demographics: Slicing by age, gender, or location can be incredibly revealing. You might discover one of your products is a surprise hit with a younger audience, which is gold for tailoring your marketing messages.
Segmentation is what turns a basic funnel report into a powerful diagnostic tool. It helps you stop asking what is happening and start understanding who it's happening to and why.
If you want to get really granular with your tracking, a good Conversions Measurement Guide can help ensure your numbers are solid from the start.
Calculate Conversion and Drop-Off Rates
With your funnel mapped and your segments defined, it's time to run the numbers. The two most critical metrics you'll look at between each stage are conversion rate and drop-off rate. They're two sides of the same coin.
The conversion rate is the percentage of people who make it to the next step. The drop-off rate is the percentage of people who leave at that stage. Simple.
Let's walk through a quick e-commerce scenario:
- Stage 1 - Product Page: 1,000 users land here.
- Stage 2 - Add to Cart: 100 of them add the item to their cart.
- Stage 3 - Initiate Checkout: 60 of those 100 start checking out.
- Stage 4 - Purchase: 30 users actually complete the purchase.
Now, let's do the math.
- Product Page to Cart Conversion: (100 / 1000) = 10%. This means you have a 90% drop-off rate right out of the gate.
- Cart to Checkout Conversion: (60 / 100) = 60%. A 40% drop-off.
- Checkout to Purchase Conversion: (30 / 60) = 50%. Another 50% drop-off.
The numbers don't lie. While losing half your users at checkout isn't great, the 90% drop-off between the product page and the cart is a five-alarm fire. That’s the single biggest leak in your funnel, and it's exactly where you need to focus your energy first.
This infographic neatly summarizes the core metrics you'll be tracking in your analysis.

By keeping a close eye on Conversion Rate, Time to Convert, and Drop-off Rate, you get a full picture of both the efficiency and the friction in your customer's journey. Now that you know how to find the problems, you might want to learn more about how to increase your e-commerce conversion rate with proven strategies for growth.
Finding and Fixing Leaks in Your Funnel
Okay, you've mapped your data and sliced it into meaningful segments. Now comes the fun part: playing detective. This is where conversion funnel analysis shifts from just observing what's happening to figuring out why. Your numbers are the breadcrumbs leading you to the leaks; your job is to find the source.
A high drop-off rate is never a random fluke. It's a direct signal that something in the user experience is causing friction, confusion, or doubt. You need to pinpoint that exact roadblock and get it out of the way.
Diagnosing Common Funnel Problems
While every funnel has its own unique quirks, I've seen the same problems pop up again and again over the years. A massive drop-off at checkout, for instance, is a classic e-commerce headache. The root cause could be anything from sticker shock over shipping costs to a clunky form that’s a nightmare on a mobile phone.
To get to the bottom of it, you have to pair your quantitative data (the numbers) with qualitative insights (the user experience). This is where tools offering session recordings and heatmaps become absolutely essential. There's nothing quite like watching how a real person interacts with a troublesome page to see the exact moment they throw their hands up and leave.
Here are some of the most frequent offenders I see causing funnel leaks:
- Unexpected Costs: Hidden fees or high shipping costs that only appear on the final step are probably the #1 cause of cart abandonment. Period.
- Forced Account Creation: Many people will simply bail if you make them create an account before they can buy. Always offer a guest checkout. It's an easy fix with a huge payoff.
- Lack of Trust Signals: A checkout page missing security badges, customer reviews, or a clear return policy can make users nervous about handing over their payment details.
- Technical Glitches: It sounds obvious, but you'd be surprised. A broken button, a page that takes forever to load, or a form that just doesn't work on certain devices will kill your conversions dead.
When you combine the "what" from your analytics with the "why" from user behavior tools, you can form a solid hypothesis about what needs fixing.
The Real-World Impact of Fixing a Single Leak
It’s incredibly easy to look at a small issue and underestimate how much money it's costing you. But a single, well-hidden problem can quietly bleed revenue for months. A fantastic example of this comes from the UK retail giant, Sainsbury's. Their conversion funnel analysis flagged an alarming 47.7% of customers dropping off at the checkout page.
Digging deeper, they uncovered a specific technical bug. This glitch was preventing customers from choosing the popular 'buy and collect in-store' delivery option, forcing countless frustrated users to abandon their carts. Once the team found and fixed this one issue, Sainsbury's recovered over £200,000 in lost revenue each quarter. This case study is a powerful reminder of how a detailed analysis can lead directly to major financial gains and a much better user experience. You can read more about this impressive fix in a detailed breakdown of the funnel analysis process.
From Observation to Actionable Insights
Making the jump from just staring at drop-off rates to actually diagnosing their root causes is the most critical skill in funnel analysis. The data points you in the right direction, but your investigation reveals what to fix.
The goal is to build a complete picture. You might see a 60% drop-off on your payment page. Session recordings could then show you that users are repeatedly clicking a broken "Apply Coupon" button, getting frustrated, and leaving.
This combination of hard numbers and real human behavior gives you the confidence to act. You're no longer just guessing what the problem is; you have clear proof. This approach allows you to roll out targeted, high-impact solutions instead of just throwing things at the wall and hoping something sticks. It turns your analysis from a simple reporting task into a direct driver of business growth.
Implementing Fixes and Measuring the Results

Finding the leaks in your funnel is a huge breakthrough, but that’s really only half the job. The real growth kicks in when you start methodically plugging those leaks and, crucially, measuring the impact. This is the moment your detailed funnel analysis stops being a report and starts being an engine for revenue.
Of course, not all fixes are created equal. You’ve probably found a handful of issues, and trying to tackle them all at once is a recipe for chaos. The secret is to prioritize your efforts so you’re putting your resources where they’ll make the biggest splash.
Prioritizing Fixes Based on Impact and Effort
To avoid getting lost in a sea of minor tweaks, I always recommend a simple impact-versus-effort framework. It’s a straightforward way to sort your potential fixes into logical buckets, making sure you work on the most valuable stuff first.
Think of it this way: a broken “Buy Now” button on your checkout page is a high-impact, low-effort fix. It’s a no-brainer that should jump to the top of your to-do list. On the other hand, A/B testing a slightly different shade of blue on a secondary call-to-action is probably a low-impact change that still requires a decent amount of setup.
Here’s a practical way I like to categorize potential fixes:
- Quick Wins (High Impact, Low Effort): These are your low-hanging fruit. We're talking about fixing broken links, clarifying confusing microcopy, or making sure a form field isn't broken on mobile.
- Major Projects (High Impact, High Effort): These are the bigger swings that promise significant returns. Think redesigning a product page from the ground up or completely overhauling the checkout flow.
- Fill-Ins (Low Impact, Low Effort): These are smaller tweaks you can handle when you have some downtime, like updating an old icon or rewording a non-critical headline.
- Time Sinks (Low Impact, High Effort): Stay away from these. They burn through time and money for very little measurable return.
This approach gives you a clear roadmap. Knock out the quick wins to build momentum and show some immediate results, then start scheduling the major projects that will drive real, long-term growth.
Scientifically Validating Your Solutions
Once you have a hypothesis for a fix, the temptation is to just push it live and hope for the best. But I’ve learned the hard way that making changes based on gut feelings can sometimes do more harm than good. The professional approach is to validate your solutions scientifically using A/B testing.
A/B testing, or split testing, is pretty simple in concept. You create a new version of your page (the "variant") with your proposed change and show it to a portion of your traffic. The original page (the "control") is shown to the rest. You then let the test run and see which version converts better.
By running a controlled A/B test, you take the guesswork out of the equation. The data will tell you, with statistical confidence, whether your change actually moved the needle. This is how you prevent implementing a “fix” that accidentally tanks your conversion rate.
This testing process is the bedrock of continuous improvement. If you're hunting for specific ideas to test, our guide on proven strategies to improve your e-commerce conversion rate is packed with actionable tactics.
Measuring Success with Historical Funnel Data
So, you’ve run a test and have a winning variation. Job done? Not quite. The final, critical step is to measure the long-term success of your changes to confirm they truly delivered. This is where your historical funnel data becomes your ultimate source of truth.
You need to zoom out and look at your funnel’s performance over a longer period. This helps you understand the bigger picture of user behavior. Modern analytics tools let you compare key metrics like Conversion Rate, Average Conversion Time, and total Converted Users across different timeframes. This historical view confirms the impact of your changes beyond the initial A/B test and helps you spot wider trends.
Quantifying the impact is what really matters. Learning how to calculate lift in sales provides the hard evidence you need to prove your optimizations worked. For example, if your checkout page converted at 45% last month and it’s hitting 55% this month after your fix, you have clear proof of a 22% lift. That’s a win you can take to the bank.
Tracking this data creates a powerful feedback loop. Every fix you implement and measure adds to your team's collective knowledge, making every future analysis smarter and more effective. This data-driven cycle is what separates struggling stores from the ones that achieve sustainable, long-term growth.
Common Questions About Funnel Analysis
Even with the best tools and a solid plan, digging into a funnel analysis always seems to stir up new questions. It’s a totally normal part of the process, whether this is your first time or your fiftieth. Let's walk through some of the most common hurdles I see marketers face and give you some clear, practical answers to push past them.
This isn’t about abstract theory; it's about solving the real-world problems that pop up the moment you start looking at the data. The goal here is to give you the confidence to troubleshoot these issues and squeeze every drop of value out of your analysis.
What if My Funnel Has Low Traffic?
This is a big one, especially for newer businesses or niche products. When your traffic volume is low, a single conversion—or lack thereof—can throw your percentages way off, making it hard to trust the numbers. Trying to run a statistically significant A/B test can feel pretty much impossible.
Don't get discouraged. Instead, you need to shift your focus from quantitative to qualitative analysis. Having fewer users is actually a golden opportunity to go deep on each one.
- Prioritize Session Recordings: Seriously, watch every single user session you can. Since the volume is manageable, you can manually analyze what the few users you do have are doing and see exactly where they get stuck.
- Use User Surveys: Pop a simple, one-question survey on key pages. Ask visitors something direct like, "What's the one thing stopping you from signing up today?"
- Conduct User Interviews: Reach out directly to the handful of customers or leads you have. Ask for a 15-minute chat. The insights you'll get from just a few real conversations are often worth more than broad statistics at this stage.
When traffic is low, every visitor is a precious source of information. Use this phase to truly understand user intent on a personal level before you have the volume for large-scale number crunching.
How Do I Choose the Right Tool for a Small Business?
The sheer number of analytics tools out there can be overwhelming, and a lot of them come with enterprise-level price tags. For a small business, the game is all about finding a tool that gives you the most insight for the least cost and complexity. You don't need a sledgehammer to crack a nut.
My advice? Start with the powerful free tools before you even think about committing to an expensive subscription.
My go-to recommendation for any small business is to start with a combination of Google Analytics 4 (GA4) for quantitative data and a free plan from a tool like Hotjar or Crazy Egg for qualitative insights. GA4 will show you what is happening, while Hotjar’s heatmaps and recordings will show you why.
This two-part toolkit is almost always more than enough to run a solid funnel analysis without breaking the bank. Only after you've pushed these free tools to their limits should you consider paid options like Mixpanel, which are really built for more complex product analytics in SaaS or mobile apps.
Micro vs. Macro Conversions: What's the Difference?
Getting your head around this distinction is absolutely vital for a nuanced analysis. It's the difference between seeing the whole picture and just staring at the finish line.
A macro conversion is the main event—the primary goal of your entire funnel. It's the big win. For an e-commerce store, that’s a completed purchase. For a SaaS business, it’s a paid subscription.
Micro conversions, on the other hand, are all the smaller steps a user takes on the path toward that main goal. Think of them as actions that signal interest and engagement.
Examples of micro conversions include:
- Watching a product video
- Downloading a PDF guide
- Adding an item to a wishlist
- Signing up for a newsletter
Tracking these smaller commitments is incredibly important. They show you that users are moving in the right direction, even if they aren't ready to pull the trigger on the macro conversion just yet. A high number of micro conversions paired with a low number of macro conversions is a classic sign: your final offer or call-to-action isn't compelling enough, even though you've clearly captured the user's interest.
Ready to stop guessing and start fixing the leaks in your funnel? At ECORN, we specialize in conversion rate optimization and Shopify development to turn your data into revenue. Let's build a better customer journey together.


