
Trying to run an e-commerce business on gut feelings is a surefire way to lose money, especially in today's market. Simply put, e-commerce demand forecasting is all about using your own data to make educated guesses about what your customers will want to buy, when they'll want it, and how much you'll need. It’s how you move from just reacting to sales to proactively planning for them.
Why Guessing Your Inventory Needs Is Costing You Money
Let's be real—most e-commerce brands start out managing their inventory with a "best guess" approach. You glance at last month's numbers, add a little extra for growth, and hit "order." That might get you by for a little while, but it's a strategy that just doesn't scale. As your business grows, that guesswork quickly turns into a serious financial leak.
Getting it wrong is expensive. The costs pile up from two sides of the same coin: having way too much stock, or not nearly enough.
The Hidden Costs of Overstocking
When you order too much, you're not just taking up warehouse space; you're tying up your cash. Every dollar stuck in unsold products is a dollar you can't put toward marketing campaigns, developing new products, or any other part of your business that actually drives growth.
This excess stock almost always leads to:
- Skyrocketing Storage Fees: Warehouses charge for space and time. The longer your products gather dust, the more you pay. Simple as that.
- Forced Sales and Markdowns: To clear out old inventory, you have to run steep discounts. Those slashed prices come directly out of your profit margins.
- Product Obsolescence: If you're in a fast-moving industry like fashion or electronics, last season's inventory can become virtually worthless overnight.
This vicious cycle turns your inventory from a valuable asset into a costly liability.
The Opportunity Cost of Stockouts
On the flip side, running out of stock can be even more destructive. When a customer is ready to buy but sees that dreaded "Out of Stock" message, you don't just lose that one sale. The damage goes much deeper.
A stockout sends a clear message: your brand is unreliable. That customer is probably heading straight to a competitor, and there’s a good chance they won't be back. You've lost not only the immediate revenue but also the entire potential lifetime value of that customer. You’re literally handing business to your rivals.
Key Takeaway: In e-commerce, every single inventory decision is a financial one. The whole point of demand forecasting is to find that sweet spot—having just enough product to meet demand without freezing your capital in items that aren't moving.
The pressure to get this right is only increasing. With global online retail sales projected to hit a staggering $7.4 trillion in 2025, making up almost a quarter of all retail spending, the stakes have never been higher. Add to that an estimated 2.77 billion digital buyers worldwide, and you can see why nailing your inventory is critical. You can dig into more e-commerce growth figures to really grasp the scale of the opportunity.
Making the shift from simply tracking past sales to predicting future ones isn't just a smart move anymore—it's essential for survival. This isn't just about managing inventory; it's about making smarter, data-backed decisions across your entire business.
Gathering the Right Data for a Reliable Forecast

Any e commerce demand forecasting model, no matter how sophisticated, is only as good as the data you feed it. Think of it like cooking: even a Michelin-star chef can’t create a masterpiece with rotten ingredients. Your historical data is the foundation of your forecast, and its quality will make or break your results.
The goal here is simple but crucial: build a clean, comprehensive dataset that shows the true, organic sales patterns of your business. "Garbage in, garbage out" isn't just a cliche; it's the iron law of forecasting. You'll need to pull this information directly from your e-commerce platform, whether it's Shopify, WooCommerce, or something else, to create this foundational view.
Your Core Data Checklist
Before you can even think about analysis, you need to collect the right pieces of the puzzle. Start by exporting detailed reports covering at least one to two years of sales history, if you have it. The more data you can get your hands on, the better your model will be at spotting long-term trends and seasonal cycles.
Your main data export should, at a bare minimum, include these fields:
- Historical Sales Data (by SKU): This is the heart and soul of your forecast. You need to know how many units of each specific product or variant were sold, and on what dates.
- Product Information: Details like product category, price, and cost of goods sold (COGS) are essential for deeper analysis and figuring out profitability.
- Customer Data (Anonymized): Geographic information (like city/state/country) and customer segments can highlight regional demand pockets you might otherwise completely miss.
- Inventory Levels: Having historical on-hand inventory data is critical for identifying past stockouts—a vital cleanup step we’ll get to next.
Once you have this raw data, the real work begins. It’s not enough to just dump these numbers into a model; you have to clean and add context to them first.
Identifying and Handling Data Anomalies
Your sales history is never a perfectly smooth line. It's full of spikes and dips caused by specific events. If you don't account for these anomalies, they will poison your forecast, tricking your model into predicting phantom demand that will never show up.
Imagine a fashion brand getting ready for the fall season. Last August, they ran a massive "End of Summer" clearance sale, causing a huge, artificial spike in sales for sandals and t-shirts. If they blindly include that spike in their forecast for the upcoming August, their model will mistakenly predict another surge. They'll end up over-ordering summer stock right as the weather is about to turn cold.
This is exactly why spotting anomalies is so important.
Expert Tip: Create a "promotional calendar" that maps out all your past major sales events, marketing campaigns, influencer shout-outs, and press mentions. Lay this calendar over your sales data to see exactly which spikes were driven by your actions versus organic demand.
You have to isolate and either remove or adjust these outliers. For a one-time event like a clearance sale, you might just exclude that week's data from your baseline. For a recurring event like Black Friday, you'll want to flag it as a seasonal event, not a typical sales day.
Another huge anomaly to look out for is a stockout. If a hot product was out of stock for two weeks, your sales data will show zero units sold. A naive model would interpret this as zero demand, when the reality is that demand was probably through the roof. You have to correct for this by estimating the lost sales during that period or by excluding it from your calculations entirely. To learn more about building a resilient inventory strategy, check out our in-depth guide on demand forecasting for ecommerce.
Segmenting Your Data for Deeper Insights
A single, store-wide forecast is a blunt tool. For surgical precision, you need to segment your data and create separate forecasts for different product groups or even customer types. This approach uncovers trends that get completely lost in the overall average.
Some of the most effective ways to segment your data include:
- By Product Category: The things that drive demand for "women's outerwear" are completely different from "men's accessories." Forecasting them separately gives you a much clearer, more actionable picture.
- By Price Point: High-ticket items often have very different sales cycles and customer behaviors compared to low-cost, high-volume products.
- By New vs. Returning Customers: Understanding the buying habits of these two groups helps you fine-tune both your inventory planning and your marketing efforts.
By gathering clean data, filtering out the noise, and segmenting your view, you build a solid, reliable foundation. This prep work is hands-down the most important part of creating a demand forecast you can actually trust to make smart business decisions.
Choosing the Right Forecasting Model for Your Store
Picking a forecasting model isn't about finding the one "best" method—it’s about finding the one that’s right for your business, right now. The best approach for e commerce demand forecasting depends entirely on where you are in your journey, from the data you have on hand to your product's lifecycle.
What works for a big-box retailer with years of data is often overkill for a growing Shopify store. Your choice generally boils down to two main camps: qualitative and quantitative forecasting. Each has its place, and knowing when to use which is key.
When to Use Qualitative Forecasting
Think of qualitative forecasting as being less about crunching numbers and more about tapping into human expertise and market intel. This is your go-to strategy when you have little to no historical data to work with.
Imagine you're launching a completely new, innovative product. There are no past sales figures to analyze, so you have to get creative and lean on other sources of information.
This is exactly where qualitative methods come in handy:
- Expert Opinion: Pull together insights from industry experts, your own marketing and sales teams, or even seasoned advisors. Their collective experience can provide a surprisingly solid starting point for a prediction.
- Market Research: Running customer surveys, hosting focus groups, or even just analyzing social media polls gives you direct feedback on what potential customers are thinking before you sink a ton of cash into inventory.
- Competitor Analysis: Check out how similar products are performing. While it’s not a perfect one-to-one comparison, it gives you a realistic baseline to work from.
For instance, if you're launching a new line of sustainable pet toys, you’d look at how existing eco-friendly pet products are selling, survey your current audience about their interest, and get input from your product team. It’s an educated guess, not a shot in the dark.
When to Use Quantitative Forecasting
Once your product has been selling for a while, you’ve started to build the single most valuable asset for forecasting: historical sales data. This is where quantitative methods step in, using that past data to project future demand with a more data-driven approach.
These models range from the beautifully simple to the incredibly complex, so you can scale up your methods as your business grows. The trick is to start with a model you can actually manage and understand.
I see so many founders jump to a complex model way too soon. A simple Moving Average model that you can run consistently is far more valuable than a sophisticated AI forecast you don't understand and can't maintain.
The infographic below shows how different forecasting models can stack up, comparing forecasted sales against the real numbers and highlighting the forecast error rates for a few popular methods.
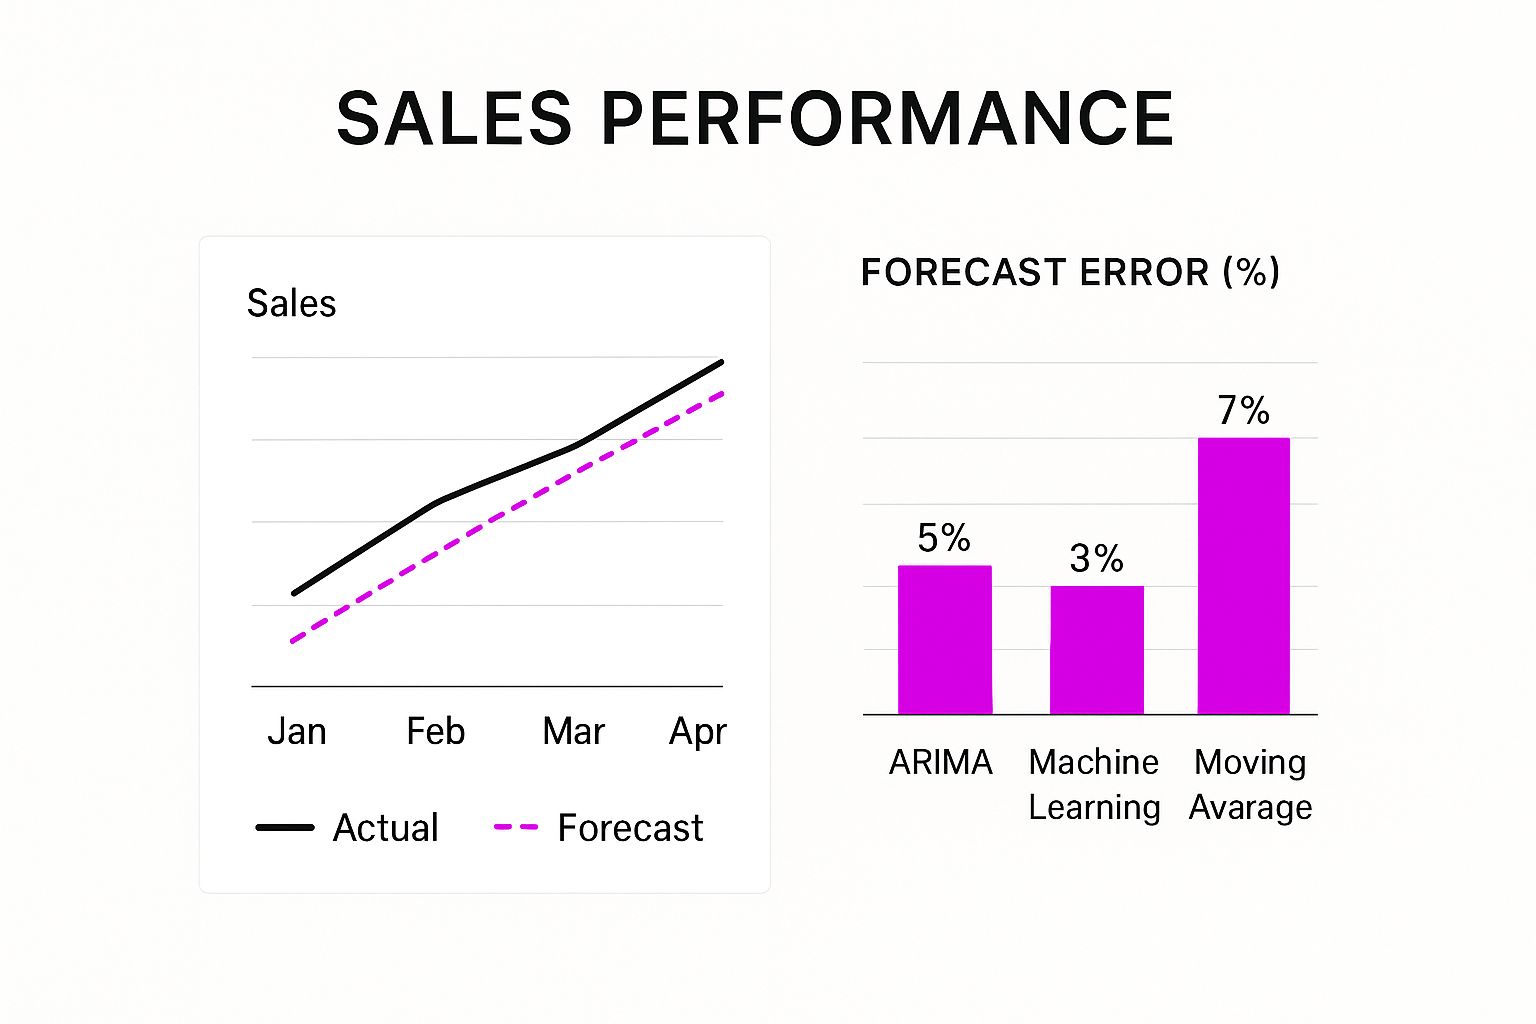
As you can see, a simple Moving Average might have a higher error rate, but more advanced models like ARIMA and Machine Learning can get much more accurate by factoring in more variables.
Comparison of Demand Forecasting Methods
To get started, you need to match the method to your current reality. Are your sales stable? Do they spike during certain seasons? The answers will point you to the right model.
For a store with relatively steady sales, a Simple Moving Average (SMA) is a fantastic starting point. It just averages your sales data over a set period (like the last 30 or 90 days) to predict what's next. It’s easy to do in a spreadsheet and gives you a solid baseline.
But if your products are trendy or seasonal, you'll outgrow the SMA pretty quickly. That's when a method like Exponential Smoothing becomes a much better fit. It gives more weight to your most recent sales data, making it quicker to react to changes in demand. It’s a bit more complex, but it’s great at capturing momentum.
To help you decide, here’s a quick breakdown of the most common quantitative methods.
The journey of e commerce demand forecasting is all about iteration. Start with a simple model you can master. As your business grows and your data gets richer, you can graduate to more powerful techniques. The goal is to continuously refine your predictions, turning your forecast from a rough guess into a powerful strategic weapon.
Using AI to Predict Future Demand
While traditional forecasting models give you a solid baseline, they have a major blind spot. They’re great at looking backward at your own sales data, but that means they can't see the external forces about to hit your business. This is where artificial intelligence takes e-commerce demand forecasting into a completely new league.
AI and machine learning models do something traditional methods simply can't: they look outside your four walls. They analyze a huge array of real-time variables that influence why, when, and how your customers decide to buy. This creates a dynamic, living forecast that adapts to the world as it changes, not just what happened last quarter.
Instead of just extrapolating from past sales, AI incorporates a much richer, more complex set of inputs. It’s the difference between a static report and an active strategic tool.
Beyond Historical Sales Data
The real magic of AI is its ability to connect the dots between your sales and what’s happening in the wider world. It can process massive, unstructured datasets to find subtle patterns a human analyst would never spot.
Think about all the external factors that quietly impact your sales day-to-day:
- Competitor Pricing: An AI can monitor competitor sites and predict how a rival's new 20% off sale will affect demand for your comparable products.
- Social Media Sentiment: It can track mentions and sentiment on platforms like TikTok or Instagram, flagging a product that’s about to go viral before the sales spike even begins.
- Weather Patterns: For certain industries, this is a game-changer. An AI model can pull weather API data to predict a surge in demand for raincoats in a specific region next week.
- Macroeconomic Indicators: Factors like consumer confidence or inflation rates can be woven into the model to adjust forecasts for broader economic shifts.
Let’s say you run a beverage company. An AI tool could monitor real-time weather forecasts and see a heatwave is predicted for the Midwest in ten days. The model would then automatically recommend increasing the inventory of iced tea and lemonade at your regional fulfillment center. This is a level of proactive planning that simple, history-based models just can’t touch.
Making AI Forecasting Accessible
The idea of implementing machine learning might sound like you need a team of data scientists on payroll, but that’s no longer the case. The rise of user-friendly tools and integrated Shopify apps has put this technology within reach for businesses of all sizes.
These platforms handle all the complex modeling behind the scenes. You simply connect your data sources—your Shopify store, your ad platforms, maybe even external feeds—and the AI does the heavy lifting. This allows you to account for incredibly complex consumer behaviors without writing a single line of code.
This shift is crucial as shopping habits continue to evolve. With predictions that nearly 70% of online shoppers will prefer using smartphones for purchases in 2025, and over 50% prioritizing fast shipping, forecasting accuracy is more critical than ever. You need to align your logistics with this fluctuating, on-the-go demand.
Key Insight: AI doesn't just improve your existing forecast; it changes what you're forecasting. It shifts the focus from "what did we sell?" to "what factors will drive sales next?" This allows you to understand the true impact of your marketing efforts and external market forces.
AI for Practical Decision Making
This advanced analytical power translates directly into smarter, more profitable business decisions. By moving beyond simple historical analysis, you can get answers to more complex questions that genuinely drive growth and efficiency.
The integration of predictive analytics for ecommerce allows you to do more than just manage stock levels. It unlocks new strategic capabilities across your entire operation, helping you plan with much greater confidence.
Here’s how it plays out in the real world:
- Smarter Marketing Spend: See how a planned promotion is likely to impact demand for specific SKUs, helping you allocate your marketing budget for maximum ROI.
- Optimized Staffing: Predict busy periods with greater accuracy, ensuring your customer service and fulfillment teams are staffed appropriately to handle the rush.
- Reduced Waste: For brands with perishable or seasonal goods, AI can dramatically reduce obsolescence by providing more precise end-of-life forecasts.
Ultimately, using AI for demand forecasting is about gaining a competitive edge. It provides the foresight to act instead of react, turning your inventory and supply chain from a source of cost into a strategic advantage. It’s about being prepared for what’s coming, not just analyzing what has already happened.
A forecast is just an educated guess until you use it to make a real-world business decision. The true power of e-commerce demand forecasting is unlocked when those numbers on your spreadsheet translate directly into smarter inventory management and a more resilient supply chain. This is where prediction meets action.
The ultimate goal here is to let your forecast guide your purchasing. This means moving beyond reactive, last-minute POs and instead building a proactive system for replenishment. Two of the most critical parts of this system are setting intelligent reorder points and calculating the right amount of safety stock.
Setting Smarter Reorder Points
A reorder point (ROP) is the inventory level that tells you, "Hey, it's time to order more of this product." When calculated properly, your new stock arrives just as your current inventory is about to run out, preventing those costly stockouts without tying up a ton of cash in your warehouse.
Your demand forecast is the engine that drives this whole calculation. You'll need three key pieces of information:
- Forecasted Daily Demand: How many units you realistically expect to sell each day, straight from your forecast.
- Supplier Lead Time: The number of days it takes for new inventory to show up after you place an order. Don't forget to account for weekends and holidays!
- Safety Stock: A small buffer of extra inventory to protect against things going sideways, like an unexpected demand spike or supplier delays.
The formula itself is pretty simple: (Forecasted Daily Sales x Lead Time in Days) + Safety Stock. By plugging your forecast data into this formula, you create a dynamic trigger that’s tuned specifically to your anticipated sales velocity.
Calculating the Right Amount of Safety Stock
Think of safety stock as your insurance policy against uncertainty. It’s the buffer that saves you from lost sales when a product suddenly goes viral on TikTok or a container ship gets stuck somewhere. Too little safety stock leaves you vulnerable, but piling it on just inflates your carrying costs and ties up capital you could be using elsewhere.
This is another area where your demand forecast helps you find that sweet spot. One of the most important inputs for any safety stock calculation is your forecast accuracy. If your forecasts have been historically spot-on, you can get by with a leaner safety stock. If your predictions have a wider margin of error, you'll naturally need a bigger buffer.
This data-driven approach is a world away from just tacking on an arbitrary 15% to your order and hoping for the best.
A forecast is a living document, not a one-time report. The real value comes from creating a feedback loop where you consistently compare your predictions to actual results and use those insights to get smarter over time.
This iterative process of refinement is what separates the brands that thrive from those that just survive. You need a structured way to measure how you're doing and feed those lessons back into your model.
Creating a Continuous Improvement Feedback Loop
A forecast that isn't regularly reviewed and updated is guaranteed to become useless. Building a simple, consistent review cycle is the most critical step in turning your forecasting efforts into a sustainable competitive advantage. This doesn't have to be complicated.
Your feedback loop should really boil down to two key activities: tracking forecast accuracy and conducting regular reviews.
First, you need a simple way to measure how close your predictions were to reality. One of the most common and effective metrics is the Mean Absolute Percentage Error (MAPE). It calculates the average percentage difference between what you thought you'd sell and what you actually sold. A lower MAPE means a more accurate forecast.
Tracking your MAPE over time gives you a clear benchmark for improvement. It helps you see which products are easy to predict and which are all over the place, allowing you to adjust your safety stock levels with real data.
Next, get a consistent review schedule on the calendar. For most e-commerce businesses, a monthly review cycle is the perfect rhythm. It gives you enough data to be meaningful without being overwhelming.
- Compare Last Month's Forecast vs. Actuals: Pull the sales data and calculate your MAPE for the previous month.
- Analyze Deviations: For the biggest misses (both high and low), dig in and ask why. Was there a flash sale you forgot to account for? A competitor's promotion? A stockout that artificially capped sales?
- Refine Your Model: Use these insights to adjust the inputs for your next forecast. Maybe you need to give more weight to recent sales trends or add a new variable to your model, like upcoming holidays.
- Generate the New Forecast: Run your updated model to create the forecast for the next month.
This simple, repeatable process ensures your e-commerce demand forecasting gets progressively more accurate. It transforms forecasting from a static, one-and-done task into a dynamic, strategic function that constantly learns and adapts to the realities of your business.
Your E-commerce Forecasting Questions, Answered
As you dive into e-commerce demand forecasting, you'll definitely have questions. It’s one thing to understand the concept, but it's another to actually put it into practice and troubleshoot the real-world challenges that pop up for your store. Let's get straight to the point and answer some of the most common questions we hear.
How Far Ahead Should I Forecast Demand?
There isn't a single magic number here. The best forecast horizon is the one that lines up perfectly with your supply chain's reality. The most important question you can ask is, "How long does it take to restock?" Your lead time is the key that unlocks this answer.
If you’re in a fast-paced niche like trendy fashion or specialty foods, you need to stay agile. A short-term forecast, looking out 30 to 90 days, is your best bet. It lets you react quickly to shifting consumer tastes and avoid getting stuck with yesterday's hot item.
On the other hand, if your products have much longer lead times—think custom-built furniture or items sourced from overseas suppliers—you have to look much further down the road. For these businesses, a forecast that spans 6 to 12 months is crucial. You simply have to place those inventory orders far in advance.
Expert Insight: For most stores, the sweet spot is a rolling forecast. Don't just set a big annual forecast and forget it. Instead, you constantly update your predictions, maybe monthly or quarterly. This keeps your strategy flexible and ensures your decisions are always based on the freshest data you have.
This approach gives you the best of both worlds: you can plan for the long term while still being quick enough to adapt to what the market is doing right now.
How Do I Forecast for a New Product Launch?
This is easily one of the trickiest parts of e-commerce forecasting. When you have zero sales history, you can’t lean on past data. You have to get a bit creative and use qualitative methods to build an intelligent first guess.
First, look for similar products—or "look-alikes"—in your own catalog. If you're launching a new vegan leather handbag, what can you learn from the sales speed and customer interest in your existing leather bags? This gives you a solid internal benchmark to start from.
Next, it's time to do some direct market research to see what customers think. You can do this by:
- Sending Customer Surveys: Poll your email list to gauge their interest in the new product concept.
- Checking Social Media Engagement: Post mockups or "coming soon" teasers on your social channels. Pay close attention to the likes, comments, and shares to get a feel for the excitement level.
- Analyzing Competitors: See how similar launches from your competitors went. Look at their pricing, marketing, and what customers are saying in reviews to set a realistic baseline for your own launch.
The smartest move is to start with a conservative initial inventory order. In those first few weeks, your main job is to watch sales velocity like a hawk. That early sales data is pure gold and will give you the confidence you need to plan your first major reorder.
What Is the Best Forecasting Software for Small Businesses?
The "best" software is simply the one that fits your store's current size, complexity, and your own technical comfort level. There's no one-size-fits-all answer, but the options usually fall into a few camps.
If you're running on Shopify, starting with an integrated app makes a lot of sense. Tools like Inventoro or SKU IQ are built to plug right into your store's data. They offer a friendly user experience to get you started with forecasting without a major learning curve.
As your business grows and gets more complex, you might outgrow those initial tools and need a more dedicated system. Platforms like Cin7 or Skubana are designed for multi-channel retailers and give you more powerful features for managing inventory across different sales channels and warehouses.
But don't write off a good old-fashioned spreadsheet. For a new business just finding its footing, using a simple moving average or weighted moving average model in Google Sheets or Excel is a completely valid—and very low-cost—way to start your e-commerce demand forecasting journey.
Ready to move beyond guesswork and build a resilient inventory strategy for your Shopify store? At ECORN, we specialize in implementing data-driven solutions that help brands scale efficiently. From CRO to development, our team provides the expertise you need to turn your data into your biggest asset. Discover how we can help you grow.


10 Best Practices for Site Navigation in 2026
Return vs Refund for Shopify Stores: A Practical Guide
What Is Customer Lifetime Value and Why It Matters
What Is Voice of Customer Research for eCommerce

SMS Marketing for Ecommerce That Actually Converts

Master How to Improve Email Deliverability in 2026

Top 7 eCommerce Partners NYC for Shopify Brands in 2026
Machine Learning for Ecommerce: Boost Your Shopify Store

Beauty Market Research: Your 2026 Growth Guide

Shopify International Expansion: A 2026 Roadmap
What Does CRO Stand for in Business: Understanding CRO

Shopify Visual Merchandising: A Playbook for Higher Sales

Shopify Landing Page Design: Master Conversion in 2026
10 Best AI SEO Optimization Tools for Shopify in 2026

Agentic AI for Ecommerce: Boost Your Sales in 2026
Mastering Email Marketing Data for eCommerce Growth
Conversion Rate Optimisation Australia: Boost Your Sales
Conversion Rate Optimization AI: Your Shopify Store Guide

10 Product Bundling Strategies for Shopify in 2026
How to Increase Customer Lifetime Value: A Shopify Playbook
AI Customer Service Automation: Shopify Guide 2026
Clean Website Design: A Shopify Conversion Playbook

Omnichannel Retail Strategy: A Shopify Playbook
Product Data Enrichment: A Guide for Shopify Brands
Instagram Shopping Features a Guide for Shopify Stores
What Is Revenue Optimization: A Holistic RevOps Guide
Benefits of Conversion Rate Optimization: Boost Your
WordPress to Shopify Migration: Your 2026 Seamless Switch
Boost Sales: Ecommerce Payment Processing Guide 2026
Unified Commerce Platform: Benefits, KPIs & Shopify Guide
How to Reduce Bounce Rate eCommerce: Your 2026 Guide
Shopify API Integration: A Practical End-to-End Guide
How to Implement Data Governance: A 2026 Guide
Shopify Store Development Cost: A 2026 Breakdown
What Is Server Side Tracking: The Shopify Guide 2026
Marketing Automation Workflows: A Shopify Guide for 2026
Shopify: How to Reduce Technical Debt

Shopify UX Design Change: A Playbook for Growth
User Generated Content Strategy: Shopify Playbook

Shopify Pause and Build Plan Cost: A Complete 2026 Guide
Compare at Price on Shopify: A Complete Guide for 2026
Where Can I Sell My Prints? 10 Best Platforms for 2026
Shopify Order Management System: The Ultimate Guide 2026
What Is Marketing Attribution? an eCommerce Guide for 2026
10 Best Black Friday Sales Sheets for 2026

Discover the Top Social Media Marketing Agencies For
Consumer Confidence Definition for eCommerce in 2026
What Is Social Commerce? Your 2026 Guide to Boosting Sales
A Social Ad Campaign Playbook for eCommerce Growth
7 Best FAQ Page Examples for SaaS & eCommerce

Market Research in Fashion Industry: A Guide for Shopify
Shopify Migration Services: Expert Guide for 2026
Mastering FB Retargeting Ads for Shopify in 2026
What Is Omnichannel Ecommerce
Master Your Shopify Plus Migration: The 2026 Guide
Shopify Integration Services: A Merchant's 2026 Guide
Shopify Collection Description: A Guide to SEO & Sales
Shopify Plus Contact: Reach Sales & Support Effectively

Top Luxury Shopify Stores: Design & UX Strategies
How to Improve Customer Experience: A Shopify Roadmap
Creative Facebook Ads: 10 Examples for Shopify Brands

Remarketing with Facebook Ads: A Shopify Guide for 2026

SEO Linking Strategies for Shopify Stores
Top 7 Statistics YouTube Channels for eCommerce in 2026

Hiring Shopify Plus Designers: A Founder's Guide
Shopify Product Variation: Master Your Variants for 2026

Leverage Ai Solutions Brands: Your 2026 Shopify Growth Guide

Filters in Shopify: A Guide for Growing Brands

Shopify Plus Developer: A Guide for Growing Brands

When Does Black Friday Online Start? A 2026 Guide
Black Friday Email Marketing: Shopify & Klaviyo Guide

Polaris Design System: The Complete Shopify Guide

How to Hire a Consultant Email Marketing Expert
What Is Q4? A Shopify Merchant's Guide to Peak Season

Marketing Organization Structure for eCommerce Growth
Top Account-Based Marketing Agency Guide for 2026

7 Remarketing Ad Examples for Your 2026 Campaigns

AI Retail Solutions: Boost Your Shopify Store

Migrate to Shopify: The Definitive 2026 Guide
Shopify Authentication App: A Guide for Secure Stores
Why Strategic Marketing Is Important for Growth in 2026
How to Create a Size Chart in Shopify: 2026 Guide

Shopify Themes for Jewelry: The Definitive 2026 Guide

Minimal Shopify Templates: Faster, Higher-Converting Stores
Maximize Profit: Shopify CC Fees 2026 Guide

Best Shopify Apps for Beginners in 2026
How to Improve Online Shopping Experience in 2026

Shopify Design and Development Services: A 2026 Guide

Small Business Social Media Marketing Agency: A Hiring Guide
Bulk Edit Shopify: A Guide to Save Hours on Store Updates

2026 Trends in Food and Beverage Industry
Post Purchase Survey Guide for Shopify Stores

How to Build an Ecommerce Brand in 2026
Conversion Rate Optimization for Ecommerce: Maximize Profit
How to Use Customer Data to Increase Sales: A Guide
Shopify for Enterprise: The 2026 Deep Dive Guide

Email Marketing Agencies: The Guide for Shopify Brands
Boost Sales With The Right Shipping Shopify App
Your Guide to the Shopify Site Map
7 Headless Commerce Examples for 2026


newsletter in your inbox