
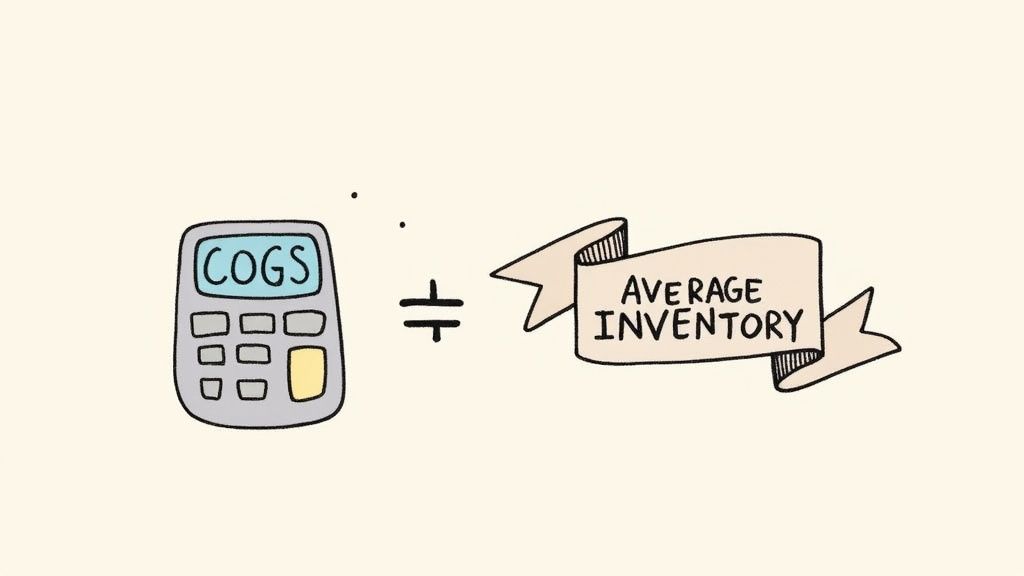
To figure out your inventory turnover, you just need to divide your Cost of Goods Sold (COGS) by your average inventory value for a specific period. It's a straightforward formula that tells you exactly how many times your business sold and restocked its entire inventory. Getting this calculation down is a huge step toward smarter cash flow management.
What Inventory Turnover Reveals About Your Business

Think of inventory turnover as a vital sign for your products. It's a core financial metric that gauges how well your supply chain and sales processes are working together. At its heart, it tells you how fast you're turning physical stock into cold, hard cash.
A high, healthy turnover rate is almost always a sign of strong product demand and efficient operations. It means your capital isn't just collecting dust on a shelf—it's actively generating revenue. On the flip side, a sluggish turnover can point to some serious hidden problems that are quietly draining your bank account.
Why This Metric Matters
Understanding your turnover ratio isn't just about crunching numbers for a report. It gives you a direct, unfiltered look into the engine room of your business:
- Cash Flow Health: The faster your turnover, the quicker you convert inventory into cash. This directly improves your liquidity, giving you more freedom to reinvest, pay bills, and grow.
- Warehouse Efficiency: A low turnover means you’re racking up high carrying costs. You're paying for storage, insurance, and security for products that just aren't moving, not to mention the risk of them becoming obsolete.
- Overall Profitability: Every aspect of efficient inventory management—from minimizing waste to jumping on sales opportunities—feeds directly into your bottom line.
A low turnover rate might mean you're overstocked or your sales have hit a wall. But an extremely high rate isn't always good news, either—it could signal you're understocked and at risk of stockouts, which leads to lost sales and frustrated customers. The goal is always to find that sweet spot.
Simply put, the inventory turnover ratio measures how many times you sell and replace your stock over a set period, usually a year.
For instance, if a business has a COGS of $400,000 and an average inventory of $45,000, its turnover ratio is about 8.89. This tells us the company cycled through its entire inventory almost nine times that year. You can then benchmark inventory turnover by industry to see how you stack up. Ultimately, nailing this calculation is a non-negotiable skill for any serious e-commerce operator.
Finding the Right Data in Your Financials
Before you can crunch the numbers, you need to know exactly which numbers to crunch. Getting your inventory turnover right hinges on pulling the correct data from your financial statements. Let's walk through where to find the two key ingredients.
First up is your Cost of Goods Sold (COGS). You'll find this line item on your income statement, which you might also know as a profit and loss (P&L) statement.
COGS is exactly what it sounds like: the direct cost of everything you sold. This includes what you paid for the raw materials and the direct labor that went into creating your products. It's crucial to remember that it does not include indirect costs like marketing spend or your sales team's salaries.
Locating Your Average Inventory Value
The second piece of the puzzle is your average inventory value. Using this figure instead of a single point-in-time value gives you a much more realistic picture, smoothing out the peaks and valleys caused by things like seasonal rushes or big supplier orders.
To calculate this, you'll need to head over to your balance sheet and grab two numbers:
- Beginning Inventory: The value of your inventory at the very start of the period (e.g., January 1st).
- Ending Inventory: The value of that same inventory at the period's close (e.g., December 31st).
With those two values in hand, the math is straightforward:(Beginning Inventory + Ending Inventory) / 2 = Average Inventory
Let's say you started the year with $20,000 in stock and finished with $30,000. Your average inventory for the year would be $25,000. It's as simple as that.
A common—and costly—mistake is using total sales revenue instead of COGS in the turnover formula. Revenue includes your profit margin, which inflates the final number and gives you a false sense of efficiency. Always stick to COGS to compare the cost of inventory sold against the cost of inventory held.
Calculating Your Inventory Turnover Ratio
Alright, you've got your numbers lined up. Now for the fun part: putting them to work. The formula itself is pretty simple, but walking through a real-world scenario is the best way to see how it all clicks together. To get this right, you really need a firm grip on understanding your Cost of Goods Sold (COGS).
Let's use a tangible example. Imagine a small online business that sells artisan coffee beans. They've had a solid year and now want to see just how efficiently they managed their stock.
Putting the Formula into Action
First, they pull up their income statement and pinpoint their annual Cost of Goods Sold: $120,000. This number represents the direct cost of every single bag of coffee they sold all year.
Next up is the average inventory. For this, they’ll need their balance sheets from the start and end of the year.
- Beginning Inventory: $15,000
- Ending Inventory: $25,000
They plug these into the average inventory formula:
($15,000 + $25,000) / 2 = $20,000
With those two pieces, they have everything they need to calculate their inventory turnover:
$120,000 (COGS) / $20,000 (Average Inventory) = 6
So, what does that 6 actually mean? It means the coffee retailer sold through and completely replaced its entire stock 6 times over the course of the year.
This infographic breaks down that whole process beautifully, from gathering the data to getting your final number.

As you can see, it’s a straightforward, three-part process. You're simply turning raw financial data into a metric that tells a powerful story about your performance.
Translating Your Ratio into Days
A turnover ratio of 6 is a great starting point, but it's still a bit abstract. How do you make that number truly useful? You translate it into days.
This is where the Days Sales of Inventory (DSI), or inventory days, comes in. It tells you, on average, exactly how many days it takes to sell through your inventory.
Here’s the simple formula for DSI:
365 days / Inventory Turnover Ratio
For our coffee business, it looks like this:
365 / 6 = 60.8 days
This gives them a much clearer picture. It takes the artisan coffee retailer roughly 61 days to turn its stock into cash. That’s a far more actionable insight than just the number '6,' giving them a concrete timeline for their sales cycle.
Making Sense of Your Inventory Turnover Number
So, you’ve run the numbers and have your inventory turnover ratio. Great. But that number on its own is just data—the real magic happens when you figure out what it's actually telling you about your business. A common mistake is thinking a higher number is always the goal, but the reality is a lot more nuanced than that.
A high turnover ratio can be a fantastic sign. It often points to strong sales, high demand, and an efficient operation. But it can also be a red flag. If your ratio is sky-high, you might be understocking and constantly teetering on the edge of a stockout. Those lost sales from frustrated customers who can’t get what they want are silent profit killers.
On the flip side, a low turnover ratio usually means you're sitting on too much inventory. Your cash is tied up in products that are collecting dust instead of generating revenue. For anyone dealing in perishable goods or fast-moving trends, a low number is especially dangerous because it screams "risk of obsolescence."
Context Is King
The single most important thing to remember when looking at your ratio is industry context. What's considered "good" for a grocery store would be a disaster for a car dealership.
- A fast-fashion retailer might aim for a turnover of 8-10. They have to move trendy items fast before they're out of style.
- A heavy machinery dealer, on the other hand, might be perfectly happy with a ratio of 2-3. Their products are high-value, have long sales cycles, and nobody is impulse-buying a bulldozer.
This is why benchmarking against your industry is non-negotiable. It gives your number a frame of reference.
Industry Benchmark Inventory Turnover Ratios
To give you a clearer picture, here’s a look at some typical inventory turnover ratios across different sectors. See where you might fit in.
Remember, these are just general guidelines. Your specific niche and business model will ultimately determine the ideal number for you.
The goal isn't just a high number; it's the right number for your specific business model. It reflects a perfect balance between meeting customer demand without tying up excessive capital in slow-moving stock. Getting this balance right requires a deep dive into different inventory forecasting methods.
To really get a handle on what your inventory turnover means, it helps to zoom out a bit. Think of it as one piece of a much larger financial puzzle. By mastering ratio analysis as a whole, you can see how this one metric connects with other key performance indicators. This bigger picture gives you a clearer view of your operational health and empowers you to make smarter, more profitable decisions.
Actionable Ways to Improve Your Turnover Rate
Calculating your inventory turnover is like a health check-up for your business. Now comes the treatment plan. A low turnover ratio isn't a failure; it’s a flashing sign pointing to where you can make impactful changes.
Let's get practical. The goal is to move the needle on one of the two parts of the turnover formula. You either want to increase your Cost of Goods Sold (COGS) by selling more or decrease your average inventory by holding less stock. Here’s how you can actually do it.
Fine-Tune Your Demand Forecasting
The most direct way to keep your average inventory down is to stop over-ordering. This all starts with getting smarter about your demand forecasting.
Don’t just glance at last year’s sales. You need to dig deeper. Look at recent trends, consider seasonality, and factor in any upcoming marketing campaigns that are designed to spike demand. Better forecasting means you won't have cash tied up in products that are just collecting dust.
Pro Tip: A great starting point is to identify your "C-grade" inventory—the products that are your slowest sellers. These are the first items you should consider ordering less of. Freeing up that capital lets you reinvest in your fast-moving "A-grade" products that are actually making you money.
Get Rid of Obsolete and Slow-Moving Stock
Every warehouse has a "graveyard" section for products that haven't moved in months, maybe even years. This is your obsolete inventory, and it's doing more than just taking up space. It's actively costing you money in storage fees and represents a huge missed opportunity. You have to be ruthless about clearing it out.
Here are a few proven ways to turn that dead stock back into cash flow:
- Run a Flash Sale: A strategic discount can do wonders for your COGS. A well-timed sale not only moves those slow items but can also bring a rush of new customers through your digital doors.
- Create Product Bundles: This is a classic tactic for a reason. Pair a slow-moving item with a bestseller. It instantly increases the perceived value of the bundle and helps you shift the less popular product without slashing its price.
- Use Liquidation Channels: Sometimes, you just need to cut your losses and move on. Sell the stock in bulk to a liquidation company. You won’t get the full cost back, but you’ll get cash in hand and free up that precious warehouse space immediately.
Many businesses are now leaning on smart technology to make these decisions easier and more data-driven. For instance, automated inventory management systems are brilliant at flagging slow-moving stock and streamlining your reordering process. Building stronger relationships with your suppliers is another key piece of the puzzle—if you can shorten lead times, you can operate with a much leaner inventory from the get-go.
Common Questions About Inventory Turnover
Even with a clear formula in hand, things can get a little fuzzy when you start applying inventory turnover to your actual business. Real-world scenarios always bring up new questions.
Let's clear the air and tackle some of the most common ones I hear from store owners. Getting these details right is what turns this metric from a simple number into a tool that actually helps you make smarter decisions.
Can I Just Use Sales Revenue Instead of COGS?
This is probably the most frequent question I get, but the answer is a hard no. You absolutely have to use the Cost of Goods Sold (COGS), not your sales revenue.
Why? Because your revenue includes your profit margin. Using it will seriously inflate your turnover ratio and paint a misleadingly rosy picture of how efficient you are. The whole point is to compare the cost of what you sold to the cost of what you're still holding. It's the only way to get a true, apples-to-apples comparison.
How Often Should I Be Calculating This?
At a bare minimum, you should be running this number annually as part of your year-end financial review. But honestly, for most businesses, that’s not nearly often enough to catch problems before they snowball.
If you're in a fast-moving space like e-commerce or retail, I'd strongly recommend calculating your turnover ratio quarterly or even monthly. This frequency lets you spot trends—like a sudden sales slump for a key product—while you still have time to do something about it.
What Are the Limitations of This Metric?
Inventory turnover is incredibly valuable, but it’s not a silver bullet. You need to be aware of its blind spots.
For one, it’s an average. This means it can easily hide issues with specific SKUs. You could have one "hero" product flying off the shelves, making your overall ratio look great while masking dozens of slow-movers that are quietly tying up your cash.
It also doesn't account for seasonality unless you calculate it for shorter, specific periods. Always look at this metric alongside other crucial data points, like your gross margin and individual product sales reports, to get the full story of your business's health.
Ready to turn these insights into action? The team at ECORN specializes in optimizing Shopify stores, from refining inventory strategies to boosting conversion rates. Discover how our eCommerce expertise can help you scale efficiently.


Omnichannel Retail Strategy: A Shopify Playbook
Product Data Enrichment: A Guide for Shopify Brands

Instagram Shopping Features a Guide for Shopify Stores
What Is Revenue Optimization: A Holistic RevOps Guide
Benefits of Conversion Rate Optimization: Boost Your

WordPress to Shopify Migration: Your 2026 Seamless Switch
Boost Sales: Ecommerce Payment Processing Guide 2026
Unified Commerce Platform: Benefits, KPIs & Shopify Guide

How to Reduce Bounce Rate eCommerce: Your 2026 Guide

Shopify API Integration: A Practical End-to-End Guide

How to Implement Data Governance: A 2026 Guide

Shopify Store Development Cost: A 2026 Breakdown
What Is Server Side Tracking: The Shopify Guide 2026
Marketing Automation Workflows: A Shopify Guide for 2026

Shopify: How to Reduce Technical Debt

Shopify UX Design Change: A Playbook for Growth

User Generated Content Strategy: Shopify Playbook

Shopify Pause and Build Plan Cost: A Complete 2026 Guide
Compare at Price on Shopify: A Complete Guide for 2026

Where Can I Sell My Prints? 10 Best Platforms for 2026
Shopify Order Management System: The Ultimate Guide 2026
What Is Marketing Attribution? an eCommerce Guide for 2026
10 Best Black Friday Sales Sheets for 2026

Discover the Top Social Media Marketing Agencies For
Consumer Confidence Definition for eCommerce in 2026

What Is Social Commerce? Your 2026 Guide to Boosting Sales

A Social Ad Campaign Playbook for eCommerce Growth

7 Best FAQ Page Examples for SaaS & eCommerce

Market Research in Fashion Industry: A Guide for Shopify

Shopify Migration Services: Expert Guide for 2026

Mastering FB Retargeting Ads for Shopify in 2026
What Is Omnichannel Ecommerce

Master Your Shopify Plus Migration: The 2026 Guide
Shopify Integration Services: A Merchant's 2026 Guide
Shopify Collection Description: A Guide to SEO & Sales

Shopify Plus Contact: Reach Sales & Support Effectively

Top Luxury Shopify Stores: Design & UX Strategies

How to Improve Customer Experience: A Shopify Roadmap

Creative Facebook Ads: 10 Examples for Shopify Brands

Remarketing with Facebook Ads: A Shopify Guide for 2026

SEO Linking Strategies for Shopify Stores
Top 7 Statistics YouTube Channels for eCommerce in 2026

Hiring Shopify Plus Designers: A Founder's Guide

Shopify Product Variation: Master Your Variants for 2026

Leverage Ai Solutions Brands: Your 2026 Shopify Growth Guide

Filters in Shopify: A Guide for Growing Brands

Shopify Plus Developer: A Guide for Growing Brands

When Does Black Friday Online Start? A 2026 Guide
Black Friday Email Marketing: Shopify & Klaviyo Guide

Polaris Design System: The Complete Shopify Guide

How to Hire a Consultant Email Marketing Expert

What Is Q4? A Shopify Merchant's Guide to Peak Season

Marketing Organization Structure for eCommerce Growth

Top Account-Based Marketing Agency Guide for 2026

7 Remarketing Ad Examples for Your 2026 Campaigns

AI Retail Solutions: Boost Your Shopify Store

Migrate to Shopify: The Definitive 2026 Guide

Shopify Authentication App: A Guide for Secure Stores

Why Strategic Marketing Is Important for Growth in 2026

How to Create a Size Chart in Shopify: 2026 Guide

Shopify Themes for Jewelry: The Definitive 2026 Guide

Minimal Shopify Templates: Faster, Higher-Converting Stores
Maximize Profit: Shopify CC Fees 2026 Guide

Best Shopify Apps for Beginners in 2026

How to Improve Online Shopping Experience in 2026

Shopify Design and Development Services: A 2026 Guide

Small Business Social Media Marketing Agency: A Hiring Guide

Bulk Edit Shopify: A Guide to Save Hours on Store Updates

2026 Trends in Food and Beverage Industry

Post Purchase Survey Guide for Shopify Stores

How to Build an Ecommerce Brand in 2026
Conversion Rate Optimization for Ecommerce: Maximize Profit
How to Use Customer Data to Increase Sales: A Guide

Shopify for Enterprise: The 2026 Deep Dive Guide

Email Marketing Agencies: The Guide for Shopify Brands

Boost Sales With The Right Shipping Shopify App

Your Guide to the Shopify Site Map

7 Headless Commerce Examples for 2026

Mastering Trends in Cosmetic Industry for 2026

Transfer Shopify to BigCommerce The Complete 2026 Playbook

What Is Shopify Collective? Your 2026 Guide to Success

Unlock Shopify Growth with Site Link SEO

Integrating Shopify and WordPress A Complete Guide for 2026

Naming a Clothing Store: A Shopify Founder's Playbook

Guide to buying shopify store in 2026

Buying shopify store: Buying a Shopify Store: Invest Wisely

Food & Beverage Marketing: A Complete Guide for 2026

Facebook Ads Agency: A Shopify Brand's Hiring Guide

Shopify Apparel Stores: A 2026 Launch & Scale Guide

How to Deactivate Shopify Store: The 2026 Guide

Shopify and Square: The 2026 Ultimate Comparison

Your Guide to Beauty Products Ecommerce

A Guide to Marketing for Beauty Brands in 2026

Your Guide to Facebook Black Friday Ads
Facebook Ad Ecommerce for Shopify Growth

Iconography Web Design The Definitive Guide for Shopify Stores

A Modern Backlinks SEO Strategy for Shopify Stores

How to Launch an Online Store: A Step-by-Step Success Guide

Optimize Shopify Store: Master Performance in 2026

Successful Migration for Shopify: Protect SEO & Grow


newsletter in your inbox