
Before you can fix a slow website, you have to know why it's slow. Measuring your site's performance is all about digging into the key metrics—things like load speed, interactivity, and visual stability—to get a clear picture of how real users experience your site.
This isn't just about chasing high scores on a testing tool. It's about connecting your site's technical health directly to real business goals, like keeping visitors happy, ranking higher in search, and, of course, making more money.
Why Website Performance Is Your Most Important Metric

Before we get into the nitty-gritty of the tools and numbers, let’s be crystal clear on why this matters so much. A slow or clunky website isn't a small problem; it's a direct hit to your credibility and your bottom line. User expectations are higher than ever, and every single millisecond really does count.
The link between a speedy site and a successful business is impossible to ignore. A fast, responsive experience makes people want to stick around, click on more pages, and eventually buy something. This kind of positive engagement is exactly what search engines like Google are looking for—they've even made page experience a core part of their ranking algorithm.
To give you a clearer picture, let's break down the main areas of website performance and see how they tie back to what you're trying to achieve.
Key Areas of Website Performance and Their Impact
As you can see, these aren't just technical stats; they are the foundation of a good user experience that drives business growth.
The Real Cost of a Slow Website
Slow performance is an active deterrent. It literally pushes potential customers away. Put yourself in their shoes: you click a link, and the page just hangs there, loading. What do you do? You hit the back button.
This isn't just a hunch. The data shows that 53% of users will abandon a page if it takes more than three seconds to load. You can find even more eye-opening website speed statistics over at DebugBear.com.
This user frustration creates a ripple effect that hurts your business in several ways:
- Lost Revenue: For an eCommerce site, even a one-second delay can cause a major dip in conversions.
- Damaged Brand Perception: A buggy, slow site can make your brand look amateurish or untrustworthy.
- Lower Search Rankings: Google wants to send its users to great sites. Slow sites aren't great, so they get pushed down the search results.
"Performance is not just a technical concern; it's a fundamental aspect of user experience. A faster site feels more efficient, more reliable, and more satisfying to use, directly influencing a visitor's perception of your brand."
Perceived vs. Actual Performance
Here’s an interesting wrinkle: there's a difference between actual performance and perceived performance.
Actual performance is what the tools measure—the cold, hard data on load times and technical metrics. But perceived performance is all about how fast the site feels to the user.
For example, a site might take ten seconds to fully load a huge background video (poor actual performance), but if it shows the main headline and navigation menu almost instantly, it creates good perceived performance. The user has something to look at and interact with right away.
The real magic happens when you master both. By prioritizing what the user sees first, you can create the impression of a lightning-fast site while the heavier elements finish loading in the background. This keeps them engaged and on the page from the moment they arrive.
Choosing Performance Metrics That Actually Matter
Diving into website performance data can feel like drinking from a firehose. You've got dozens of potential metrics staring back at you, and it's shockingly easy to get lost in a sea of numbers that don't actually tell you what you need to know.
The trick isn't to track everything. It's to track the right things—the metrics that tie directly back to your business goals and the actual experience of your customers.
A good way to get your bearings is to break your metrics into a few distinct categories. I like to think of them as telling different parts of your website's story: the initial user experience, how people engage with your site, and the ultimate business outcomes.
User Experience Core Web Vitals
Let's start with the foundation: Google’s Core Web Vitals. Honestly, these are non-negotiable. They were designed specifically to measure the real-world experience of someone landing on your page, answering crucial questions like how quickly it loads, how soon they can interact with it, and whether the layout jumps around unexpectedly.
These three pillars are your new best friends:
- Largest Contentful Paint (LCP): This is all about loading speed. You want your LCP to be 2.5 seconds or less.
- Interaction to Next Paint (INP): This measures how responsive your site is to clicks and taps. Aim for an INP below 200 milliseconds.
- Cumulative Layout Shift (CLS): This tracks visual stability—no one likes a button that moves right as they're about to click it. A good CLS score is 0.1 or less.
Nailing these metrics ensures your site feels fast, professional, and trustworthy from the very first moment.
By prioritizing metrics that reflect real user experiences, you move beyond abstract scores and start making improvements that people will actually notice and appreciate.
Engagement and Outcome Metrics
Once your site has made a great first impression, you need to know if people are actually sticking around and finding value. This is where engagement and outcome metrics step in. They tell you what happens after the page loads.
For instance, a sky-high bounce rate (where visitors leave after viewing just one page) can be a red flag that your content or products aren't hitting the mark. On the flip side, strong numbers for Time on Page and Pages Per Session show that people are genuinely exploring what you have to offer.
Ultimately, you want all this technical and engagement work to drive tangible business results. The most critical outcome metric, without a doubt, is your Conversion Rate—the percentage of visitors who buy a product, sign up for your newsletter, or take whatever key action you're aiming for.
For e-commerce stores, understanding how these different KPIs play off each other is absolutely vital. We've actually put together a deep dive on the most critical ecommerce website performance metrics that can help you connect the dots. When you can clearly link technical speed improvements to a lift in conversions, you build a rock-solid case for continuing to invest in a faster, more efficient website.
Your Essential Toolkit for Performance Measurement
Once you've zeroed in on the metrics that actually matter to your business, it's time to pick the right tools for the job. Knowing how to measure website performance isn't just about running a test; it's about understanding the two fundamental ways to gather data: synthetic monitoring and Real User Monitoring (RUM).
Think of it like this: synthetic monitoring is your controlled lab environment. You get to set the conditions. Tools like Google Lighthouse and GTmetrix simulate a user visit under a specific network speed or device type. This is absolutely critical during development for running clean, repeatable tests.
On the flip side, Real User Monitoring (RUM) is the real world. It captures performance data from your actual visitors as they browse your site. This is where you get the unfiltered truth about how your site holds up against a chaotic mix of devices, flaky network connections, and different locations.
Synthetic Monitoring for Controlled Testing
When you’re pushing a new feature live or trying to hunt down a specific bug, synthetic tools are your best friend. They give you a stable baseline to compare against, so you can see with confidence whether your latest code change helped or hurt performance.
Google Lighthouse, which is built right into Chrome DevTools, is the perfect place to start. It runs a whole battery of audits on your page and spits out a detailed report on performance, accessibility, SEO, and more.
Here's what a typical Google Lighthouse report looks like. Notice the clear, color-coded scores that instantly tell you where you stand.
The report doesn't just give you a score; it gives you homework. It points out specific opportunities, like "reduce unused JavaScript" or "properly size images," making it an incredibly actionable tool for developers.
A couple of other heavy hitters in the synthetic space include:
- GTmetrix: Great for getting detailed reports and tracking performance over time with historical data.
- WebPageTest: An advanced option that gives you incredible detail, including a frame-by-frame video of your page loading.
These tools are perfect for sanity checks before a launch and for keeping an eye on your site's health day-to-day.
The real power of synthetic monitoring lies in its consistency. It lets you isolate variables and confidently measure the direct impact of your optimization efforts before they ever reach your customers.
Real User Monitoring for Real-World Insights
Lab tests are crucial, but they don't tell the full story. That's where RUM steps in. By collecting performance data straight from your users' browsers, you get a much broader, more realistic picture of how your site is actually doing.
Tools that provide RUM data, like Google Analytics, help you answer the questions that lab tests simply can't:
- Which pages are the slowest for my real customers?
- How does performance change for users in different countries?
- Are mobile users having a noticeably worse experience than desktop users?
This real-world context is everything. You might find that your homepage, which loads in a snappy 2.1 seconds in your lab test, is taking over 6 seconds for a huge chunk of your mobile audience in a key market. That's the kind of "aha!" moment you only get from real user data.
For the most complete picture, smart businesses use a blend of both. Synthetic tools guide development, while RUM tools validate the real-world impact. As you build out your analytics stack, you'll want to explore some of the more powerful ecommerce analytics tools that can bring these different data streams together. This combination gives you the sterile lab for building and the messy real world for understanding true user experience.
How to Analyze Performance Data and Find Opportunities
Collecting data is just the beginning. The real magic happens when you turn those numbers into a clear, actionable plan for making your site faster. A performance report from a tool like Google Lighthouse can look like a wall of data at first, but every single metric tells a story about what your users are actually experiencing.
Learning to read these stories is how you uncover the biggest opportunities for improvement.
Instead of getting fixated on the overall performance score, you need to dig into the individual metrics. For example, a poor Largest Contentful Paint (LCP) score almost always points to a specific culprit, like a huge hero image or a slow-loading video right at the top of the page. This isn't just an abstract number; it's a direct reflection of a user staring at a blank space, waiting for your most important content to finally show up.
In the same way, a high Total Blocking Time (TBT) is a huge red flag that heavy JavaScript is freezing the page solid. This means users can't click on buttons, open menus, or interact with anything. It's a classic source of frustration and a surefire way to make people leave your site before it even finishes loading.
Diagnosing Common Performance Bottlenecks
Once you start connecting these metrics to real user experiences, you'll begin to see patterns. You'll learn how to diagnose common problems just by looking at the data. Think of yourself as a performance detective, using the clues in your report to solve the case of the slow website.
Here are a few classic scenarios I see all the time:
- High Time to First Byte (TTFB): If your TTFB is dragging, the problem is almost certainly on your server. Your visitor's browser is just sitting there, waiting way too long for your server to even start sending information. This could be anything from an overloaded server to inefficient database queries or a poorly configured hosting environment.
- Poor Cumulative Layout Shift (CLS): This is that annoying "jumping page" issue. It happens when things like images without defined dimensions finally load in, or when ads and banners pop onto the screen, shoving all the other content down. Your users go to click a link, only to have it move at the very last second. Infuriating, right?
- Low PageSpeed Insights Score on Mobile: A mobile score that’s way lower than your desktop score is a massive warning sign. It usually means your site isn't properly optimized for smaller screens and slower network connections. The usual suspects are uncompressed images, overly complex scripts, and a design that isn't truly responsive.
This simple decision tree helps visualize when to use synthetic tools for testing new features versus RUM for monitoring your live site.
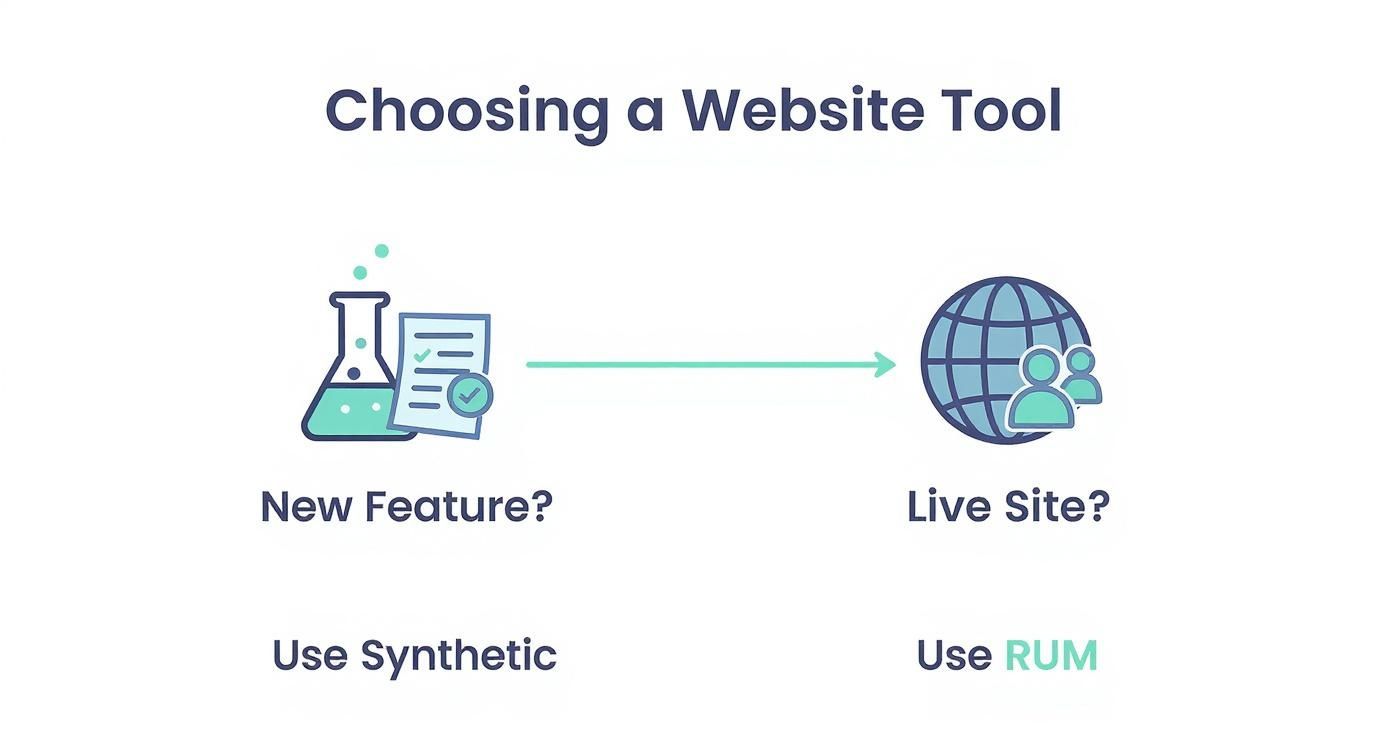
The key is to match your measurement approach to your goal. Use controlled lab data for development and lean on real-world user data for production.
Connecting Performance to User Behavior
Beyond the purely technical metrics, it's critical to see how performance is actually impacting user behavior. A high bounce rate, for instance, can be a direct symptom of a slow, clunky page. Industry benchmarks often suggest that a bounce rate over 50% is a problem for most sites, signaling that users either aren't finding what they need or are simply leaving out of frustration. If you want to dive deeper, you can discover more website statistics and their implications to see how your site stacks up.
Don't just fix the numbers; fix the experience. A faster LCP isn't about improving a metric—it's about showing your customers what they came for without making them wait.
This is where you finally connect the dots between your performance report and your business goals. Let's say your RUM data shows a slow checkout process. That could be the direct cause of a high cart abandonment rate. By optimizing that specific user journey, you're not just improving a performance score—you're directly recovering lost revenue.
Always focus on these "low-hanging fruit" opportunities first. These are the fixes that solve both a technical problem and a user pain point at the same time.
Implementing Optimizations That Deliver Real Results

You've got the data, you've pinpointed the problems. Now for the fun part: rolling up your sleeves and actually making your site faster. The key isn't to tear everything down and start over. It’s all about focusing on high-impact fixes that give you noticeable improvements right away.
These optimizations are the technical workhorses that directly pump up your Core Web Vitals and the other user experience metrics you've been tracking. You'd be surprised how much of a difference a few small changes can make to your site's speed and responsiveness.
Prioritizing Your Optimization Checklist
So, where do you start? Always go for the low-hanging fruit. Look at the assets that are bogging down your page load the most—images, scripts, and stylesheets are the usual suspects. This is where you'll find the biggest opportunities for quick wins.
Here's a practical checklist of optimizations that tend to give you the most bang for your buck:
- Compress and Modernize Images: This is a big one. Giant, unoptimized images are one of the most common performance killers I see. Use tools to compress your JPEGs and PNGs, and seriously consider switching to next-gen formats like WebP, which offer way better compression without sacrificing quality.
- Leverage Browser Caching: This tells a visitor's browser to save static assets—like your logo, CSS files, and fonts—on their local machine. When they come back to your site, the page loads in a flash because it doesn't have to re-download everything from scratch.
- Minify Your Code: Minification strips out all the unnecessary characters from your CSS, JavaScript, and HTML files. Think spaces, comments, and line breaks. It shrinks the file sizes, making them quicker to download and for the browser to parse.
"The cumulative effect of these 'small' technical fixes is profound. A 200ms reduction in load time from image optimization and another 150ms from minification can be the difference between a conversion and a bounce."
Understanding what to fix is one thing, but having a clear roadmap on how to optimize website performance is what really brings it all together.
Boosting Global Speed with a CDN
If you have an audience that spans different countries or even continents, a Content Delivery Network (CDN) isn't just a nice-to-have; it's essential. A CDN is basically a network of servers scattered around the globe, each holding a copy of your site's static assets.
When someone from Japan visits your site hosted in New York, the CDN serves them images and scripts from a server in Asia, not all the way from the US. This simple change drastically cuts down latency—the time it takes for data to travel—and makes your site feel just as fast for international visitors as it does for those right next door.
Honestly, setting up a CDN is often one of the single most effective things you can do to improve global load times and deliver a consistent experience for everyone, no matter where they are.
Connecting Fixes to Business Outcomes
Let's not forget why we're doing this. Every optimization should ultimately tie back to a business goal. Speed isn't just a technical trophy; it's a direct driver of revenue and user satisfaction. A slow site creates friction, and friction kills conversions.
Your conversion rate is the ultimate report card on how well your site turns visitors into customers. Think about it: studies have shown that 60% of consumers will bail on a purchase because of a poor user experience, which absolutely includes slow load times.
By methodically knocking out these technical bottlenecks, you're not just chasing a better Lighthouse score. You’re building a smoother, more enjoyable journey for your users—one that encourages them to stick around, explore, and ultimately, convert.
Common Questions About Website Performance
Getting into the weeds of website performance measurement can kick up a lot of questions. It's totally normal to wonder if you're chasing the right numbers or even looking at the data correctly. Let's run through some of the most common questions to clear things up so you can move forward with confidence.
How Often Should I Check My Performance Scores?
There isn’t a single magic number here, but a solid rhythm to get into is running synthetic tests (like Google Lighthouse) weekly and digging into your Real User Monitoring (RUM) data monthly.
Weekly checks are perfect for catching any new problems that might have popped up from recent site updates or code changes before they affect too many real users. Then, your monthly RUM data review gives you that bigger-picture, strategic view of how actual visitors are experiencing your site over time. It's all about spotting trends.
Think of it like this: Weekly synthetic tests are your proactive check-ups, while monthly RUM analysis is your long-term health assessment. This balance keeps you both responsive to immediate issues and strategic about your long-term performance goals.
Why Do My Scores Change So Much Between Tools?
It’s definitely frustrating to run a test on GTmetrix, Lighthouse, and WebPageTest and see three completely different scores. This almost always happens because each tool has its own unique way of measuring things.
A few key differences are usually at play:
- Test Location: A server testing from Vancouver will see different results than one testing from London. Distance matters.
- Device Type: Some tools might default to a high-powered desktop, while others mimic a more average, mid-tier mobile phone.
- Network Speed: The simulated connection speed can vary wildly, from a speedy 4G connection to a throttled, slower 3G.
The secret is consistency. Pick one primary tool for your routine checks and lock in its configuration. That way, you're always comparing apples to apples, which makes tracking your progress much more reliable.
What Is a Good Performance Score?
Look, aiming for a perfect 100 is a nice thought, but don't get obsessed. A "good" score is one that delivers a genuinely smooth experience for your users and, ideally, is a step ahead of your direct competitors. As a general rule of thumb, a Lighthouse performance score of 90 or above is a great target.
But what's even more important is passing the Core Web Vitals assessment. If your LCP, INP, and CLS metrics are all in the green, you’re already providing a fantastic user experience where it matters most. A score of 92 with passing Core Web Vitals is infinitely better than a 98 with a failing grade on a critical metric. At the end of the day, your goal is to build a fast site for humans, not just chase a high score for a machine.
Ready to turn these performance insights into higher conversion rates? The expert team at ECORN specializes in Shopify development and optimization, helping brands like yours scale efficiently. Start your project with us today!


Marketing Automation Workflows: A Shopify Guide for 2026

Shopify: How to Reduce Technical Debt

Shopify UX Design Change: A Playbook for Growth

User Generated Content Strategy: Shopify Playbook

Shopify Pause and Build Plan Cost: A Complete 2026 Guide

Compare at Price on Shopify: A Complete Guide for 2026

Where Can I Sell My Prints? 10 Best Platforms for 2026

Shopify Order Management System: The Ultimate Guide 2026

What Is Marketing Attribution? an eCommerce Guide for 2026

10 Best Black Friday Sales Sheets for 2026

Discover the Top Social Media Marketing Agencies For

Consumer Confidence Definition for eCommerce in 2026

What Is Social Commerce? Your 2026 Guide to Boosting Sales

A Social Ad Campaign Playbook for eCommerce Growth

7 Best FAQ Page Examples for SaaS & eCommerce

Market Research in Fashion Industry: A Guide for Shopify

Shopify Migration Services: Expert Guide for 2026

Mastering FB Retargeting Ads for Shopify in 2026

What Is Omnichannel Ecommerce

Master Your Shopify Plus Migration: The 2026 Guide

Shopify Integration Services: A Merchant's 2026 Guide

Shopify Collection Description: A Guide to SEO & Sales

Shopify Plus Contact: Reach Sales & Support Effectively

Top Luxury Shopify Stores: Design & UX Strategies
How to Improve Customer Experience: A Shopify Roadmap

Creative Facebook Ads: 10 Examples for Shopify Brands

Remarketing with Facebook Ads: A Shopify Guide for 2026

SEO Linking Strategies for Shopify Stores
Top 7 Statistics YouTube Channels for eCommerce in 2026

Hiring Shopify Plus Designers: A Founder's Guide

Shopify Product Variation: Master Your Variants for 2026

Leverage Ai Solutions Brands: Your 2026 Shopify Growth Guide

Filters in Shopify: A Guide for Growing Brands

Shopify Plus Developer: A Guide for Growing Brands

When Does Black Friday Online Start? A 2026 Guide

Black Friday Email Marketing: Shopify & Klaviyo Guide

Polaris Design System: The Complete Shopify Guide

How to Hire a Consultant Email Marketing Expert

What Is Q4? A Shopify Merchant's Guide to Peak Season

Marketing Organization Structure for eCommerce Growth

Top Account-Based Marketing Agency Guide for 2026

7 Remarketing Ad Examples for Your 2026 Campaigns

AI Retail Solutions: Boost Your Shopify Store

Migrate to Shopify: The Definitive 2026 Guide

Shopify Authentication App: A Guide for Secure Stores

Why Strategic Marketing Is Important for Growth in 2026

How to Create a Size Chart in Shopify: 2026 Guide

Shopify Themes for Jewelry: The Definitive 2026 Guide

Minimal Shopify Templates: Faster, Higher-Converting Stores
Maximize Profit: Shopify CC Fees 2026 Guide

Best Shopify Apps for Beginners in 2026

How to Improve Online Shopping Experience in 2026

Shopify Design and Development Services: A 2026 Guide

Small Business Social Media Marketing Agency: A Hiring Guide

Bulk Edit Shopify: A Guide to Save Hours on Store Updates

2026 Trends in Food and Beverage Industry

Post Purchase Survey Guide for Shopify Stores

How to Build an Ecommerce Brand in 2026
Conversion Rate Optimization for Ecommerce: Maximize Profit

How to Use Customer Data to Increase Sales: A Guide

Shopify for Enterprise: The 2026 Deep Dive Guide

Email Marketing Agencies: The Guide for Shopify Brands

Boost Sales With The Right Shipping Shopify App

Your Guide to the Shopify Site Map

7 Headless Commerce Examples for 2026

Mastering Trends in Cosmetic Industry for 2026

Transfer Shopify to BigCommerce The Complete 2026 Playbook

What Is Shopify Collective? Your 2026 Guide to Success

Unlock Shopify Growth with Site Link SEO

Integrating Shopify and WordPress A Complete Guide for 2026

Naming a Clothing Store: A Shopify Founder's Playbook

Guide to buying shopify store in 2026

Buying shopify store: Buying a Shopify Store: Invest Wisely

Food & Beverage Marketing: A Complete Guide for 2026

Facebook Ads Agency: A Shopify Brand's Hiring Guide

Shopify Apparel Stores: A 2026 Launch & Scale Guide

How to Deactivate Shopify Store: The 2026 Guide

Shopify and Square: The 2026 Ultimate Comparison

Your Guide to Beauty Products Ecommerce

A Guide to Marketing for Beauty Brands in 2026

Your Guide to Facebook Black Friday Ads

Facebook Ad Ecommerce for Shopify Growth

Iconography Web Design The Definitive Guide for Shopify Stores

A Modern Backlinks SEO Strategy for Shopify Stores

How to Launch an Online Store: A Step-by-Step Success Guide
Optimize Shopify Store: Master Performance in 2026

Successful Migration for Shopify: Protect SEO & Grow

Maximize Traffic & Sales: Get Your Free Website Audit Report

Master the Best Ads Facebook Formats for eCommerce Success

How to Find the Best Ecommerce Agency Near Me in 2026

10 Crucial White Hat Techniques SEO for Shopify in 2026

How to Reduce Returns and Boost Profits in Your eCommerce Store

What Is Ecommerce Personalization A Guide to Unlocking Growth

Payment gateways in shopify: The Ultimate Guide for Merchants 2026

Fulfillment services for shopify: Scale Your Ecommerce Brand

Shopify Landing Page Examples: 7 Winning Templates to Boost Conversions

How to Create Urgency in Sales on Shopify

The Best Review Apps for Shopify to Drive Growth in 2026

The Best Ecommerce Platform for Startups in 2026

Choosing Ecommerce Website Design Packages A Complete Guide


newsletter in your inbox