Stripped down to its essentials, your conversion rate is simply the percentage of website visitors who do what you want them to do. It’s the single most important metric for understanding how well your site turns casual browsers into engaged leads or paying customers.
The True Meaning of Conversion Rate

Think of your website as a physical retail store. Every person who walks through the front door is a visitor. Plenty of people will just look around, but only some will actually head to the checkout and buy something. That percentage of shoppers who complete a purchase is your store's conversion rate.
The concept is exactly the same online, but the "purchase" can be any specific goal you set. A conversion doesn't always have to be a sale; it's any valuable action a visitor takes that brings them one step closer to becoming a customer.
Defining Your Conversion Goals
What counts as a "conversion" is completely up to you and what you're trying to achieve. Some of the most common goals include:
- Making a purchase: The ultimate goal for any eCommerce brand.
- Adding an item to the cart: A critical micro-conversion that signals strong buying intent.
- Submitting a form: Capturing a lead for a free guide, a contact request, or a demo.
- Signing up for a newsletter: Growing your email list to nurture future sales.
- Creating an account: Building a relationship that encourages repeat business.
The real power of this metric is its adaptability. It gives you a clean, numerical answer to the big question: "Is my website actually working?"
To make these concepts even clearer, here’s a quick breakdown of the core components.
Key Conversion Rate Concepts at a Glance
This table shows how these simple pieces fit together to create one of the most powerful metrics for your store.
How the Basic Formula Works
Calculating your conversion rate is refreshingly simple. Just take the number of times a user completed your goal (conversions), divide it by the total number of people who visited, and then multiply by 100 to express it as a percentage.
Conversion Rate = (Total Conversions / Total Visitors) x 100%
Let's say 2,000 people visited your best-selling product page last month, and 50 of them ended up buying it. Your math would look like this: (50 / 2,000) x 100, which gives you a 2.5% conversion rate.
That one little number is incredibly telling. While the average global ecommerce conversion rate sits between 2.5% and 3.0%, this can swing wildly depending on your industry and traffic sources. Digging into conversion rate optimization statistics is a great way to see how your store stacks up against others in your niche.
How to Calculate Your Conversion Rate Accurately
Alright, you know what a conversion rate is. Now let's get into the nitty-gritty of the 'how'. While the math itself is simple, a few small details make the difference between a vanity metric and a number that actually reflects how your business is doing. Getting this right is crucial for making smart decisions down the line.
The basic formula is always the same: divide your conversions by your traffic, then multiply by 100 to get a percentage.
Conversion Rate Formula: (Number of Conversions / Total Traffic) x 100%
Simple enough, right? But here’s where people often trip up. That little term, "Total Traffic," can mean two different things. Which one you choose depends entirely on the question you're trying to answer.
User-Based vs. Session-Based Calculations
The two main ways to measure traffic come down to counting unique users or total sessions.
User-Based Calculation: This method looks at each unique person who lands on your site and counts them only once, no matter how many times they come back. It answers the question, "What percentage of individual people who visited my site ended up converting?"
Session-Based Calculation: This method counts every single visit. If the same person visits your site five times, that’s counted as five separate sessions. This answers the question, "What percentage of visits to my site resulted in a conversion?"
So, which one is better?
Imagine a customer visits your store three times in one week. They browse the first two times and finally make a purchase on their third visit.
A user-based calculation sees one user and one conversion, giving you a 100% conversion rate for that person. A session-based calculation sees three sessions and one conversion, which comes out to a 33.3% conversion rate.
For nearly every eCommerce store, the session-based calculation gives you a much clearer picture of your site's performance. It tells you how effective each visit is at turning a browser into a buyer, which is exactly what you want to know when testing changes. This is why Google Analytics defaults to a session-based model—it focuses on the effectiveness of the experience in that moment.
Practical Calculation Examples
Let's put this into practice with a few real-world scenarios you'll definitely encounter.
1. Your Overall Sales Conversion Rate
You want to know how well your entire Shopify store performed last month.
- Total Sales (Conversions): 150
- Total Website Sessions: 7,500
- Calculation: (150 / 7,500) x 100 = 2% Sales Conversion Rate
2. A Specific Product Page 'Add to Cart' Rate
You’re trying to figure out if a new product description is working. Your goal is to see how many people add that item to their cart from the product page.
- 'Add to Cart' Clicks (Conversions): 400
- Total Product Page Sessions: 5,000
- Calculation: (400 / 5,000) x 100 = 8% 'Add to Cart' Rate
3. A Landing Page Lead Signup Rate
You built a landing page to capture emails for an upcoming product launch. How well is it working?
- Form Submissions (Conversions): 75
- Total Landing Page Visitors: 900
- Calculation: (75 / 900) x 100 = 8.33% Lead Conversion Rate
By matching the right numbers to your specific goal, you can calculate your conversion rates with confidence and get a true measure of what’s working and what isn’t.
Exploring Different Types of Conversion Rates
Relying on a single, sitewide conversion rate is like only looking at the final score of a football game. Sure, you know who won, but you have no idea how they won—which plays worked, where the team struggled, or how individual players performed. To really get what's happening on your site, you need to break down your conversion rate into different types.
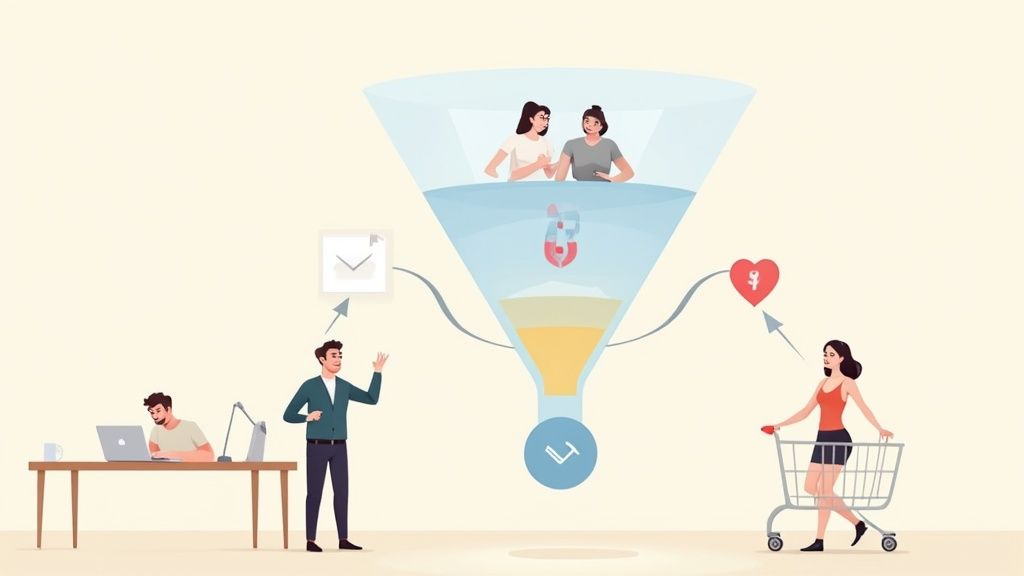
This approach gives you a much clearer picture of the entire customer journey. It helps you find exactly where your funnel is leaking and where you have some hidden opportunities for growth. Not all conversions are created equal, and they usually fall into two main buckets.
Macro vs Micro Conversions
Think about your ultimate business goal. For most eCommerce stores, that’s making a sale. This is your macro-conversion—the final, most important action a visitor can take. It's the touchdown, the sale, the main event you're driving all your efforts toward.
But let's be real, the path to a purchase is rarely a straight line. Along the way, visitors take smaller, valuable actions that signal they're interested and move them closer to buying. These are your micro-conversions. They aren't the final goal, but they are crucial steps in the process.
Common examples of micro-conversions include:
- Adding a product to the cart
- Creating a customer account
- Signing up for your email newsletter
- Watching a product demo video
Tracking these smaller wins is essential. For instance, a high "add to cart" rate but a low final purchase rate tells you that your product pages are doing a great job, but something in your checkout process is causing friction and needs to be fixed.
Segmenting Your Conversion Data
Beyond just macro and micro goals, the real magic happens when you start segmenting your conversion rate by different dimensions. This is how you move from knowing what is happening to understanding why.
The most powerful insights come from slicing your data. By analyzing conversion rates by channel, page, or visitor type, you can uncover specific problems and opportunities that a blended, sitewide rate would otherwise hide.
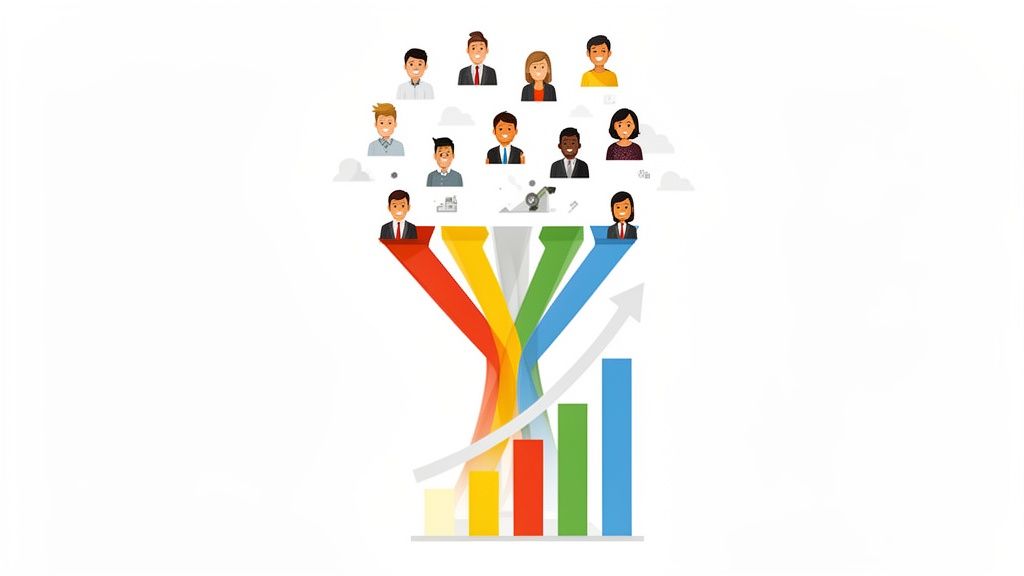
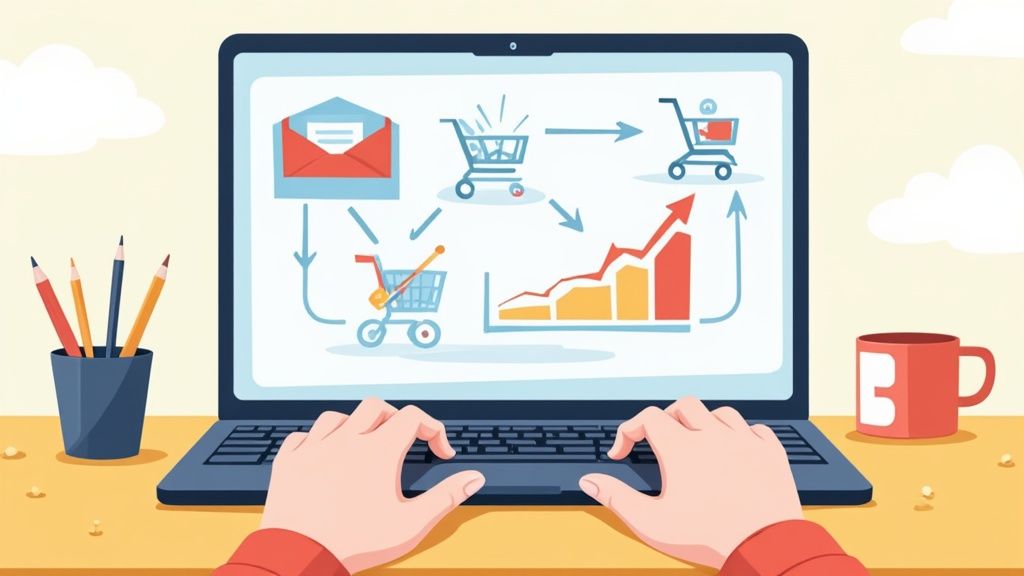
This simple flow visualizes how conversions are calculated from your total pool of visitors.

This same calculation applies to any segment you create, allowing you to isolate and analyze the performance of very specific groups.
Here are a few essential ways to start segmenting your conversion rate:
By Marketing Channel: How do visitors from your email marketing convert compared to those from social media ads? Traffic from different sources brings different levels of intent. For example, referral traffic often converts at much higher rates (up to 5.4%) than social media traffic (0.7%), which really shows the power of a warm lead.
By Visitor Type: Do new visitors convert as well as your returning customers? Breaking this down helps you understand how well your customer retention strategies are working compared to your new customer acquisition efforts.
By Page Level: What’s the conversion rate of your homepage versus a specific product page? This helps you quickly identify your most persuasive pages and shine a light on the ones that need some serious optimization.
By tracking these different types of conversion rates, you get a multi-dimensional view of your business. This is what allows you to stop guessing and start making smarter, data-driven decisions that actually fuel growth.
Finding a Good Conversion Rate for Your Business
"What is a good conversion rate?"
It’s one of the first questions every eCommerce founder asks, and it’s one of the trickiest to answer. The simple truth is, there's no magic number. A “good” rate for a store selling high-end furniture will look totally different from one selling cheap and cheerful t-shirts.
Chasing some universal average is a recipe for frustration. A strong conversion rate is deeply personal to your business. It’s shaped by your industry, how much your products cost, and where your traffic is coming from. Think of it like a car's fuel efficiency—a heavy-duty truck and a compact hybrid are both "good," but you'd never judge them by the same miles-per-gallon standard.
Context Is Everything
For one brand, a 2% conversion rate might be a massive win. For another, it could be a red flag. It’s the context behind the number that tells the real story.
Here are the three big factors that put your conversion rate into perspective:
- Your Industry: Niche markets with passionate buyers, like specialty foods, often see higher rates. Industries with a long, drawn-out decision process, like luxury goods, naturally have lower ones.
- Your Price Point: It's a lot easier to convince someone to make a $20 impulse buy than to get them to commit to a $2,000 purchase. Higher price tags mean more research, more questions, and a longer sales cycle.
- Your Traffic Source: Where a visitor comes from tells you a lot about their intent. Someone clicking a link from a trusted review site is already halfway to the checkout. A casual visitor from a social media ad? They’re probably just window shopping.
Getting a handle on these variables is the first step toward setting realistic goals. You can see how these factors play out in our complete guide to eCommerce conversion rate benchmarks.
To help you see where you might stand, here’s a quick look at how different industries stack up.
eCommerce Conversion Rate Benchmarks by Industry
A comparative look at average conversion rates across different eCommerce sectors to help you contextualize your performance.
As you can see, what’s considered “average” can swing wildly from one category to another. Don’t let a number from a totally different industry dictate your goals.
How Industry and Traffic Sources Shape Your Numbers
The data paints a clear picture of just how much conversion potential can vary. The top 20% of Shopify stores, for example, hit conversion rates of 3.2% or higher, proving what’s possible with a great user experience.
But traffic source tells an even more powerful story. Referral traffic can convert as high as 5.4% because it comes with a stamp of approval from a trusted source. Social media traffic, on the other hand, often converts at a mere 0.7%. This highlights the massive challenge of turning casual scrollers into paying customers. You can dig deeper into numbers like these by checking out key Shopify statistics.
A good conversion rate isn't a number you find—it's a number you build. It's the result of understanding your audience, optimizing their journey, and consistently delivering a great experience from the first click to the final thank you page.
Setting Your Own Benchmarks
So, where do you start? Forget the vague global averages. Your most important benchmark is you.
Start by tracking your own conversion rate month-over-month and season-over-season. This internal baseline is your true north. It tells you if your changes are working and where you’re heading.
Once you have a solid grip on your own performance, you can start looking outward. The key is to compare apples to apples. Find data for businesses that are similar to yours in size, industry, and price point. This context-driven approach will give you a far more accurate and actionable idea of what a "good" conversion rate really means for you.
Key Factors That Influence Your Conversion Rate

Knowing your conversion rate is the starting line. Actually improving it means getting into your customer's head and walking through their experience on your site. Your conversion rate is really just a reflection of dozens of moments that either build confidence or create friction.
Think of your website like a physical store. If it’s poorly lit, the aisles are confusing, and you can’t find a cashier, most people will just leave. The same exact principles apply online, where a frustrating experience is just a click away from a competitor.
Website Design and User Experience (UX)
First impressions count, big time. A clean, professional design tells visitors they’ve landed in a credible place. But great UX is more than just looking good; it's about making it dead simple for customers to find what they want and check out.
If your navigation is a maze or the text is hard to read, you're creating unnecessary work for your visitors. Their patience is thin. Your site’s one and only job is to smoothly guide them from landing page to checkout.
Key Takeaway: A website that is easy to use is a website that converts. Every design choice should be made with the customer’s journey in mind, creating a clear and simple path to purchase.
This means things like an obvious call-to-action (CTA) button, a design that works perfectly on mobile, and a logical site structure aren't just nice-to-haves. They're the absolute bedrock of a good conversion rate.
Page Load Speed
In eCommerce, seconds feel like minutes. Slow-loading pages are absolute conversion killers. If a visitor has to wait for your products to appear, they'll just bounce before they even see them. Study after study confirms that even a one-second delay can torpedo your conversion rate.
We’re all wired for instant gratification online. Making your customers wait is one of the fastest ways to lose a sale. You have to optimize your images, use fast hosting, and keep your code clean to make sure your site is snappy.
Persuasive Content and High-Quality Visuals
Your words and images are your 24/7 sales team. A strong value proposition quickly and clearly tells a shopper why they should buy from you and not from the ten other stores selling something similar. It has to answer their silent question: "What's in it for me?"
That message needs to be backed up by great visuals. For any online store, this boils down to:
- Professional Product Photos: Show your product from every angle. Use high-resolution shots and show it in use.
- Engaging Product Videos: Nothing sells like showing the product in action. It helps customers see the real-world benefits.
- Clear and Persuasive Copy: Write descriptions that focus on how the product solves a problem or improves their life, not just on a dry list of features.
Trust Signals and Social Proof
People buy from brands they trust. That trust is hard to build online, which is why trust signals are so critical. These are the little cues on your site that reassure customers they’re making a smart, safe choice.
Here are a few of the most important ones:
- Customer Reviews and Testimonials: Nothing is more powerful than seeing that other people bought the product and loved it.
- Security Badges: Displaying familiar logos for secure payments (like SSL certificates) tells shoppers their financial information is safe.
- Clear Return Policies: A straightforward, fair return policy removes the risk from the purchase decision.
It’s also important to understand how different marketing channels build trust and drive conversions. For example, learning about effective strategies for client acquisition through newsletters can give you a direct line to your most engaged audience. Ultimately, every factor—from your site's speed to its social proof—works together to create an experience that either seals the deal or sends a customer away.
Turning Your Insights Into Action
So, you’ve got a handle on how to define, calculate, and benchmark your conversion rate. That's a huge step. You now have a powerful diagnostic tool for your business.
But data is just data until you do something with it. The real magic happens when you shift from being a passive observer to an active driver of growth.
This is where Conversion Rate Optimization (CRO) comes in. Think of it as the systematic process of turning those insights into a bigger, better bottom line. It’s all about bridging the gap between knowing your numbers and actively making them better.
CRO is what transforms your understanding of "what is a conversion rate" into a real strategy for increasing revenue. It's about forming educated guesses—hypotheses—about why your users behave the way they do, and then methodically testing those ideas to build a better customer experience.
One of the most fundamental techniques in the CRO toolkit is A/B testing. It's a straightforward way to compare different versions of a page to see which one gets more people to click, buy, or sign up. If you're new to the concept, diving into some A/B testing best practices is a great place to start.
This proactive approach is how you turn numbers on a screen into decisions that lead to real, measurable improvements. For a deeper dive into practical strategies, you can explore more on how to improve e-commerce conversion rates and officially begin your optimization journey.
Your Top Conversion Rate Questions, Answered
Once you start digging into conversion rates, a few common questions always seem to pop up. Let's clear the air on some of the most frequent ones so you can apply what you've learned with confidence.
Conversion Rate vs. Click-Through Rate
What’s the real difference between conversion rate and click-through rate? It's easiest to think of them as two distinct pit stops on a customer's journey.
Click-through rate (CTR) is all about that first step—how many people saw your ad, social media post, or search result and were interested enough to click the link. It’s a direct measure of how well your initial hook grabs attention.
Your conversion rate, on the other hand, measures the next, far more important step: of all those people who landed on your site, how many actually did the thing you wanted them to do? A sky-high CTR paired with a low conversion rate is a classic sign that your ad is writing checks your landing page can't cash.
How Often Should I Check My Conversion Rate?
It’s tempting to refresh your analytics every day, but this is a classic rookie mistake. Watching it that closely often just means you’re reacting to perfectly normal, random noise.
A much smarter approach is to monitor trends on a weekly or, even better, monthly basis. This timeframe gives you enough data to spot real patterns and make decisions based on actual performance shifts, not just a random Tuesday spike.
The goal is to track the trend, not the daily noise. Looking at your conversion rate over longer periods helps you see the difference between a temporary blip and a meaningful change that needs your attention.
When a High Conversion Rate Is Actually a Bad Thing
Can a high conversion rate ever be a problem? You bet.
Imagine you launch a massive 70% off fire sale. Your conversion rate will almost certainly shoot through the roof. On the surface, it looks like a huge win.
But you have to look deeper. If your profit margins on those sales are paper-thin—or even negative—you’re basically paying people to take your products. A "good" conversion rate is meaningless if it's not profitable. You always need to look at it alongside other crucial metrics like Average Order Value (AOV) and overall profitability to get the complete picture.
Ready to turn your website's traffic into real revenue? The experts at ECORN specialize in Conversion Rate Optimization to help you get more value from every single visitor. Start improving your conversion rate today.


