
When you hear the term Average Order Value, or AOV, don't let the business jargon fool you. It's actually a straightforward, powerful metric that tells you the average dollar amount a customer spends every time they complete an order on your site.
Think of it as the average size of a shopping cart at checkout. It gives you a clean, simple snapshot of your customers' buying habits.
Decoding Average Order Value for Your Business

Let’s imagine your online store is a local coffee shop. Some folks pop in just for a quick espresso, while others grab a latte, a croissant, and a bag of beans to take home. AOV isn’t about any single one of those sales. Instead, it averages them all out to give you a single, representative number for a set period.
The math behind it is refreshingly simple.
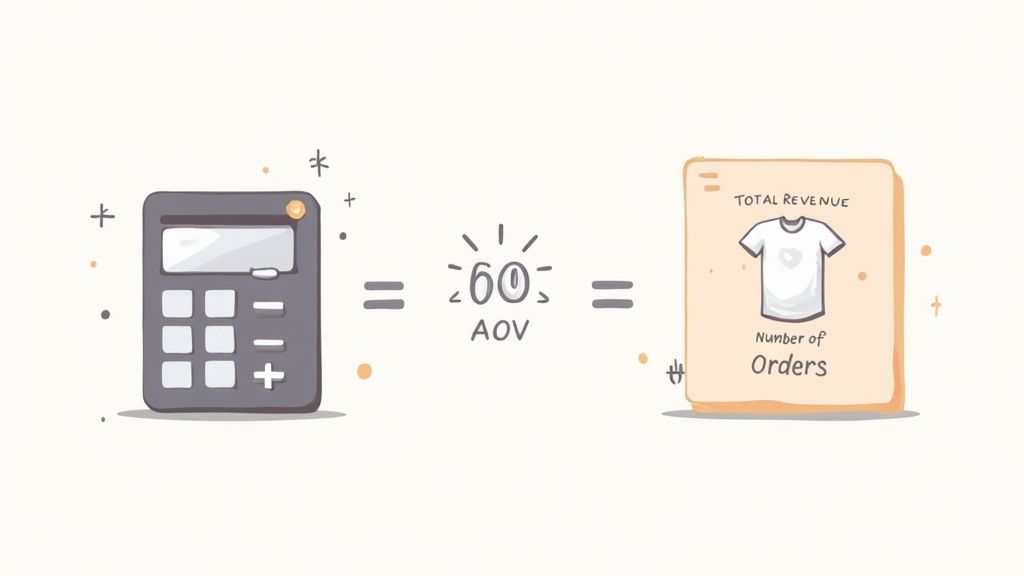
Average Order Value = Total Revenue / Number of Orders
So, if your store brought in $10,000 in revenue last month from 200 different orders, your AOV would be $50. That one figure tells you a surprising amount about the health of your business and how customers interact with your products. It's the average value each transaction brings to your brand.
For a clearer picture, here's a quick breakdown of the core concepts.
AOV Core Concepts At A Glance
This table neatly sums it up, but the real magic happens when you start using AOV to drive growth.
Why AOV Is a Critical Growth Lever
Knowing what average order value is is just the start—the real game-changer is understanding why it matters so much. Focusing on boosting your AOV is often a smarter, more sustainable growth strategy than constantly chasing new customers.
Think about it: customer acquisition is expensive. But nudging a happy, high-intent shopper to add just one more item to their cart? That's far more cost-effective.
A higher AOV trickles down to your bottom line in several ways:
- Boosted Profitability: When customers buy more per transaction, your profit margins improve, often without needing to ramp up your marketing spend.
- Better Marketing ROI: A higher AOV means every customer you acquire is more valuable, making your ad budget stretch further and work harder.
- Smarter Business Strategy: Tracking AOV helps you spot trends. You can see which products are driving bigger carts, how well your promotions are working, and what pricing strategies actually click with your audience.
This isn't just a niche strategy; it's a global trend. The worldwide average order value recently hit about $144, marking its fourth straight year of growth. Why? Because savvy merchants are using smart tactics like free shipping thresholds and clever upsells to encourage bigger spends. You can learn more about these eCommerce benchmarks and their impact.
Ultimately, AOV isn't just a number on a dashboard; it's a diagnostic tool. If it’s low or stuck, it might be a sign that your product catalog, pricing, or marketing needs a fresh look. But when you see your AOV climbing, you know your strategies are working, paving the way for scalable, profitable growth.
How to Calculate Your Average Order Value
Knowing what Average Order Value means is a good start, but the real magic happens when you actually sit down and calculate it. The good news? The formula is refreshingly simple and only requires two numbers you likely already have on hand.
The calculation for Average Order Value is straightforward:
Average Order Value = Total Revenue / Number of Orders
This little formula gives you a perfect snapshot of what a typical transaction looks like in your store over any period you choose—a month, a quarter, or even just a wild holiday weekend.
Breaking Down the Formula with an Example
Let's walk through it. Imagine you run an online t-shirt shop and want to figure out your AOV for last month.
- Find Your Total Revenue: First, pull the total sales your store generated for the period. Let’s say your shop brought in $15,000 last month.
- Count Your Total Orders: Next, you’ll need the total number of individual orders you processed in that same timeframe. You check your records and see you fulfilled 500 separate orders.
- Divide Revenue by Orders: Now, you just pop those numbers into the formula.
$15,000 (Total Revenue) ÷ 500 (Number of Orders) = $30 (Average Order Value)
Boom. The result tells you that, on average, a customer spends $30 every time they complete a purchase. This number is now your baseline—a starting point to measure all your future efforts against.
Calculating AOV for Specific Scenarios
The real power of AOV comes from segmentation. You're not just limited to looking at your entire store's performance. You can apply the exact same formula to more specific situations to unearth some seriously targeted insights.
For instance, you could calculate the AOV for:
- A Holiday Sale: Say your Black Friday sale pulled in $5,000 from 100 orders. That campaign’s AOV was $50, a huge jump from your monthly average. This tells you the promotion successfully got people to add more to their carts.
- A Specific Traffic Source: Maybe you discover that customers from an Instagram ad campaign have an AOV of $40, while visitors from organic search average just $25. This is a massive clue about which channels are bringing in your biggest spenders.
Important Considerations for Accurate Calculation
Consistency is the name of the game here. A common question that pops up is whether to include extra costs like shipping fees and taxes in your "Total Revenue" figure.
While there’s no single, universal rule, the most common and recommended practice is to exclude shipping costs and taxes. This keeps your focus purely on the value of the products customers are actually buying.
Ultimately, what matters most is that you pick a method and stick with it. Whether you include or exclude those extra costs, being consistent ensures you're always comparing apples to apples when tracking AOV over time. That consistency is what will allow you to accurately see if your strategies are truly working.
So, you've calculated your Average Order Value. The next question is always the same: "Is it any good?"
It's a natural question, but the honest answer is... it depends. There’s no magic number, no universal benchmark that signals success. What’s considered a “good” AOV is completely relative to your business.
Think of it like asking what a good price for a vehicle is. A fantastic price for a city bike would be an absurdly low, terrible price for a family SUV. They’re in totally different markets, with different costs and customer expectations. The same logic applies directly to your AOV.
What’s killer for a store selling high-volume, low-cost cosmetics will be worlds away from a boutique selling custom, high-end furniture. The first might be thrilled with an AOV of $45, while the second might see $1,500 as just their starting point.
Industry Benchmarks Set the Stage
To get your bearings, the first place to look is at industry-specific benchmarks. These numbers give you a crucial frame of reference, helping you understand how customers typically behave in your specific corner of the market. Sizing up your AOV against direct competitors or similar businesses gives you a realistic target to shoot for.
For instance, a luxury jewelry business might see AOVs floating well above $300, while a fast-fashion retailer is more likely to land somewhere in the $75 - $100 range. These aren't just random numbers; they’re a reflection of product costs, marketing angles, and the unique consumer psychology in each sector.
Let's look at a major eCommerce category to see how this plays out in the real world.
The fashion ecommerce sector is a perfect illustration of these variations. Globally, the average order value for fashion hovers around $102.30. But that number shifts depending on where you look; North American shoppers average $120.40, while their European counterparts are closer to $98.70. These differences show just how much regional market dynamics, consumer trust, and even tech like virtual try-ons can influence spending habits. You can dig deeper into these fashion ecommerce statistics for more detail.
This data proves that even within the same industry, things like location and technology can create some serious swings in AOV.
Look at AOV in the Context of Your Business
While industry numbers are a helpful starting point, they're only half the story. The most meaningful analysis comes from looking inward and measuring your AOV against your own unique business model. Don't just ask if your AOV is good—ask what it's telling you about your business.
You need to consider these key internal factors:
- Product Pricing: How does your AOV stack up against the price of your best-selling product? If your average order is consistently less than your star product, it could mean customers aren't exploring the rest of your catalog or, perhaps, that your top item is underpriced.
- Target Market: Are you selling to budget-conscious shoppers or premium buyers? A low AOV isn't necessarily a bad thing if your whole business is built on high volume and slim margins. But for a luxury brand, a low AOV is a huge red flag.
- Profit Margins: A high AOV is only great if it's profitable. If you’re hitting a $100 AOV by constantly offering deep discounts that eat away at your margins, that’s not a sustainable win. The goal is to grow AOV in a way that actually boosts your bottom line.
Setting Realistic AOV Goals
Ultimately, a "good" AOV is one that is steadily improving over time and lines up with your bigger business goals. Instead of getting hung up on one specific industry number, focus on your own growth trajectory.
Start by figuring out your baseline AOV. From there, set small, realistic goals, like aiming for a 5-10% increase over the next quarter. By tracking this progress, you can start testing different strategies—like product bundles or free shipping thresholds—and see what actually moves the needle for your audience.
This turns AOV from a static number into a dynamic, living indicator of your store’s health and the real-world impact of your marketing and sales efforts.
How To Find Your AOV in Shopify and Other Platforms
Knowing your average order value is great, but you need to know where to find it. This is where the rubber meets the road. Luckily, platforms like Shopify have made digging up this data incredibly easy, turning AOV from a simple number into a powerful tool for making smart business decisions.
For anyone running a Shopify store, this info is just a few clicks away. Your main destination is the Shopify Analytics dashboard.
Here's the quick path to get there:
- From your Shopify admin, head over to Analytics > Reports.
- Look for the Sales category in the reports section.
- Click into the report called "Sales over time." You'll see a column right there for Average order value.
This dashboard gives you a clean, at-a-glance view of your AOV over any time frame you choose. To really get the hang of it, you can master the Shopify analytics dashboard with our in-depth guide and learn what every single metric means for your store.
Unlocking Deeper Insights With AOV Segmentation
Okay, finding your store's overall AOV is just the first step. The real magic happens when you start segmenting this data to figure out who your best customers are and where they're coming from. It's all about breaking down your AOV by different variables to spot trends hiding in plain sight.
Think about it: your top-line AOV might look perfectly healthy. But once you slice it up, you might discover that your Google Ads are bringing in big spenders while your Facebook campaigns attract bargain hunters. That's the kind of insight that tells you exactly where to put your marketing dollars.
This infographic breaks down how you can segment your AOV by traffic source, marketing campaign, or customer type to get a clearer picture.
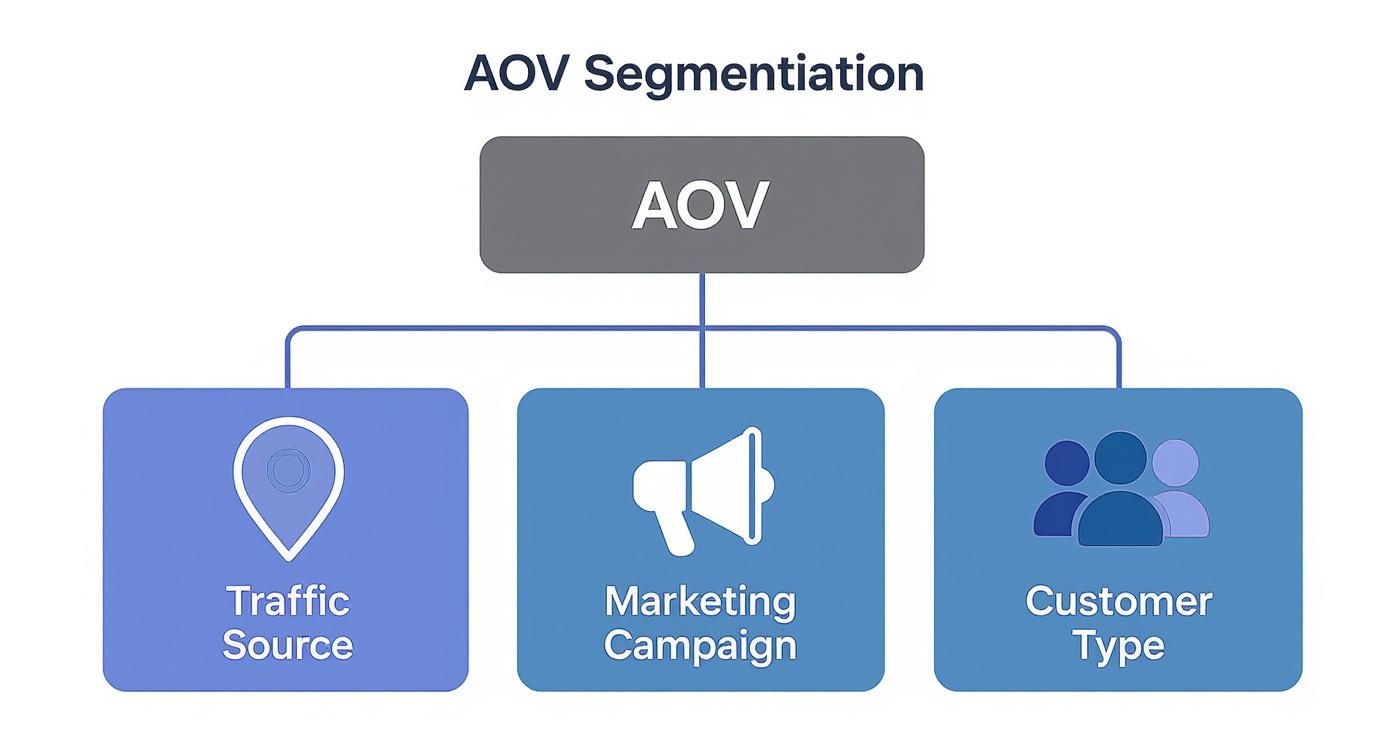
This shows that AOV isn't just one number; it's a whole collection of stories about how different customers behave. To get the most out of your platform, it’s worth reviewing the dos and don'ts of building your Shopify store to ensure you’re set up for this kind of analysis from day one.
Proven Strategies to Increase Your Average Order Value
Knowing your Average Order Value is the first step. Actually increasing it is where you start seeing serious growth. The goal isn't to strong-arm customers into spending more; it's about artfully guiding them toward purchases that genuinely add more value—both to their experience and your revenue.
This is your playbook for turning browsers into bigger buyers. Many of these tried-and-true tactics fall under the umbrella of effective ecommerce merchandising strategies, which are all about optimizing how you present products to drive higher sales.
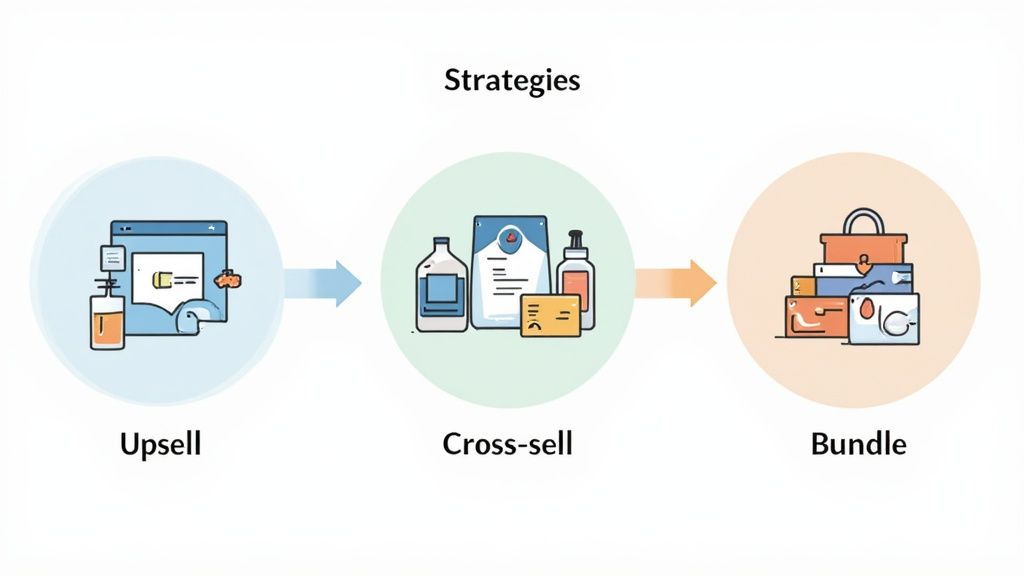
Master Upselling and Cross-Selling
Upselling and cross-selling are classic for a reason: they work. Rooted in simple psychology, these tactics are effective because you’re presenting relevant options to someone who is already in a buying mindset.
- Upselling is the art of suggesting a better, more premium version of what a customer is already looking at. Think of it as upgrading from a standard hotel room to a suite with a killer view.
- Cross-selling is all about recommending complementary items that pair perfectly with what’s in the cart. It's the timeless, "Would you like fries with that?" approach.
The secret to making both work is relevance and subtlety. If someone is buying a new laptop, suggesting a compatible mouse is a smart cross-sell. Suggesting a high-end camera? Not so much.
A great rule of thumb is to keep your recommendations reasonably priced. It’s way easier to convince someone to add a $20 item to a $100 order than it is to tack on another $100 product. The add-on should feel like a small, easy "yes."
Create Irresistible Product Bundles
Product bundles are a brilliant way to increase the perceived value of a purchase while bumping up your AOV. When you group related items together at a slight discount, you're not just selling products; you're selling a complete solution.
For instance, a skincare brand could package a cleanser, toner, and moisturizer into a "Complete Morning Routine" set. This move simplifies the decision for the customer and instantly boosts the cart size for the business.
By bundling products, you shift the customer's focus from the cost of individual items to the overall value of the complete package. This not only increases AOV but can also introduce customers to products they might not have discovered on their own.
You can also give customers the reins by letting them build their own bundles. This offers a sense of control and personalization while still nudging them toward a larger purchase. To dive deeper into this, check out our guide on how Shopify product bundles can transform your store revenue.
Implement Smart Order Minimums
Incentives tied to order minimums are one of the most powerful motivators for bigger carts. Customers are often willing to spend just a little bit more to unlock a benefit they see as valuable.
The undisputed champion here is free shipping. Study after study confirms that unexpected shipping costs are a leading cause of cart abandonment. Offering free shipping over a certain threshold is a direct solution to this major pain point.
Don't just pull a number out of thin air for your threshold. A smart move is to set it roughly 30% higher than your current AOV. If your average order is $40, a $50 free shipping threshold feels achievable and encourages shoppers to find one more small item to hit the mark.
Other incentives that work like a charm include:
- A free gift with orders over a certain amount.
- A percentage discount (e.g., 10% off orders over $75).
- A fixed dollar discount (e.g., $10 off orders over $100).
These thresholds essentially gamify the shopping experience, turning it into a mini-challenge for customers to reach the next reward level.
Choosing the right AOV-boosting strategy depends on your products, customers, and technical setup. To help you decide, here’s a quick comparison of the most popular methods.
AOV Boosting Strategies Comparison
Each strategy has its place. The key is to test what resonates most with your audience and aligns with your brand's goals. Start with the lower-effort options like a shipping threshold and then experiment with more advanced tactics as you grow.
Leverage Customer Loyalty Programs
Rewarding repeat customers isn't just about retention; it’s a powerful engine for increasing AOV. A well-designed loyalty program incentivizes customers to spend more to earn points and unlock exclusive perks.
You could create a tiered system, for example, where customers unlock better rewards as their lifetime spending increases. A "VIP" tier might offer permanent free shipping or early access to new products, motivating customers to consolidate their shopping with your brand to reach that coveted status.
This strategy builds a relationship that transcends a single transaction. Customers feel valued and have a tangible reason to make larger, more frequent purchases.
Personalize the Experience with AI
Personalization is no longer just for the retail giants. AI-powered tools make it accessible for everyone. Instead of showing every visitor the same generic recommendations, you can now display a curated selection based on their unique browsing history, past purchases, and even what’s currently in their cart.
Retailers who graduate from generic discounts to personalized promotions see much higher returns, and AI is what powers this at scale.
Here are a few ways to put this into action:
- AI-Driven Recommendations: Use apps that analyze customer data to suggest hyper-relevant upsells and cross-sells on product pages and during checkout.
- AI Chat Assistants: A smart shopping assistant can answer questions and surface tailored product suggestions in real-time, guiding customers toward a bigger, more confident purchase.
- Post-Purchase Upsells: This is a seriously underrated strategy. Offer a relevant add-on after the initial purchase is complete. It’s a zero-risk way to increase the total order value without interrupting the checkout flow. For example, if a customer just bought a pair of leather shoes, a post-purchase offer for a leather care kit is a natural fit and an easy win.
By adopting these strategies, you can systematically raise your average order value. It’s not about quick tricks; it’s about creating a smarter, more valuable shopping experience that naturally leads to bigger carts and a healthier bottom line.
How to Track AOV for Sustainable Growth
Getting your average order value to climb is more than a quick sales win; it’s a long-term play that needs a watchful eye. A common pitfall is treating AOV in a vacuum. That's how you end up with decisions that look great on paper but actually hamstring your business down the road.
For real, sustainable growth, you have to track AOV alongside other crucial eCommerce metrics. This balanced view ensures your efforts to pump up cart sizes are actually building a healthier, more profitable business.
Connecting AOV to the Bigger Picture
Think of AOV as one instrument in an orchestra. It can make noise on its own, sure, but its true magic comes out when it plays in harmony with other key performance indicators (KPIs). The two most important metrics to keep an eye on right next to your AOV are Customer Lifetime Value (CLV) and your Conversion Rate.
A sudden spike in AOV might feel like a victory, but if it comes at the expense of customer loyalty or spooks potential buyers, you’ve actually taken a step backward.
For example, you could launch an aggressive upsell campaign that drives your AOV through the roof for a quarter. But if customers feel pressured or annoyed, they won't come back, and your Customer Lifetime Value will plummet. The real goal is to grow AOV in a way that also keeps people coming back for more.
This means finding that sweet spot—the place where you successfully nudge customers toward larger orders without creating friction that wrecks the shopping experience or tanks your overall conversion rate.
Establishing a Simple Reporting Process
You don’t need some ridiculously complex dashboard to keep these metrics in check. A simple, consistent reporting habit is all it takes to keep your growth strategy grounded. Looking at these numbers together is what unlocks smarter, more informed decisions.
Your report should really just answer a few core questions:
- AOV: Is the average size of our orders actually trending up over time?
- Conversion Rate: Are the tactics we're using to boost AOV accidentally hurting our ability to turn visitors into buyers?
- CLV: Are the customers who place those bigger initial orders coming back to shop with us again?
Monitoring these KPIs in tandem stops you from robbing Peter to pay Paul—that is, optimizing one metric at the expense of another. It helps you build a solid growth engine where every order isn't just bigger, but also contributes to long-term, sustainable profit.
Common Questions About Average Order Value
Alright, we’ve covered a lot of ground. But even after getting the hang of the basics, a few specific questions always seem to come up when merchants start digging into their AOV. Let's tackle them head-on so you can move forward with confidence.
What Is a Good Average Order Value?
This is the million-dollar question, and the honest answer is: it depends. There's no magic number that works for everyone.
A "good" AOV is completely relative to your industry. For instance, a beauty brand might see orders averaging anywhere from $15 to $90, while a store selling high-end furniture could easily have an AOV well over $300.
Instead of getting fixated on a universal benchmark, your best bet is to look at your direct competitors. More importantly, focus on improving your own AOV month over month. A good AOV is one that’s consistently growing in a profitable way.
Does AOV Include Taxes and Shipping Costs?
Typically, no. The standard way to calculate AOV is based purely on the revenue from the products sold, leaving out taxes and any shipping fees. This gives you a much cleaner look at what customers are actually buying and the value of the items they're putting in their carts.
Some businesses do track an "all-in" version for internal accounting, but for strategic analysis, stick to the product-only calculation. The key is just to be consistent, whichever way you decide to measure it.
What Is the Difference Between AOV and CLV?
It's easy to mix these two up, but they measure very different—though equally important—things.
- Average Order Value (AOV) is a snapshot in time. It tells you the average amount a customer spends in a single transaction.
- Customer Lifetime Value (CLV) is the long game. It predicts the total revenue you can expect from a single customer over their entire relationship with your brand.
Think of it this way: AOV helps you maximize the value of each individual sale, while CLV guides your strategy for building loyalty and keeping customers coming back for years.
Ready to turn these insights into action? At ECORN, we specialize in Shopify development and CRO to help you not just understand metrics like AOV, but actively improve them. Discover our scalable solutions and start growing your revenue today.


AI Customer Service Automation: Shopify Guide 2026

Clean Website Design: A Shopify Conversion Playbook

Omnichannel Retail Strategy: A Shopify Playbook
Product Data Enrichment: A Guide for Shopify Brands
Instagram Shopping Features a Guide for Shopify Stores
What Is Revenue Optimization: A Holistic RevOps Guide
Benefits of Conversion Rate Optimization: Boost Your
WordPress to Shopify Migration: Your 2026 Seamless Switch
Boost Sales: Ecommerce Payment Processing Guide 2026
Unified Commerce Platform: Benefits, KPIs & Shopify Guide
How to Reduce Bounce Rate eCommerce: Your 2026 Guide
Shopify API Integration: A Practical End-to-End Guide

How to Implement Data Governance: A 2026 Guide
Shopify Store Development Cost: A 2026 Breakdown
What Is Server Side Tracking: The Shopify Guide 2026
Marketing Automation Workflows: A Shopify Guide for 2026
Shopify: How to Reduce Technical Debt

Shopify UX Design Change: A Playbook for Growth
User Generated Content Strategy: Shopify Playbook

Shopify Pause and Build Plan Cost: A Complete 2026 Guide
Compare at Price on Shopify: A Complete Guide for 2026
Where Can I Sell My Prints? 10 Best Platforms for 2026
Shopify Order Management System: The Ultimate Guide 2026
What Is Marketing Attribution? an eCommerce Guide for 2026
10 Best Black Friday Sales Sheets for 2026

Discover the Top Social Media Marketing Agencies For
Consumer Confidence Definition for eCommerce in 2026
What Is Social Commerce? Your 2026 Guide to Boosting Sales

A Social Ad Campaign Playbook for eCommerce Growth
7 Best FAQ Page Examples for SaaS & eCommerce

Market Research in Fashion Industry: A Guide for Shopify

Shopify Migration Services: Expert Guide for 2026

Mastering FB Retargeting Ads for Shopify in 2026
What Is Omnichannel Ecommerce

Master Your Shopify Plus Migration: The 2026 Guide
Shopify Integration Services: A Merchant's 2026 Guide
Shopify Collection Description: A Guide to SEO & Sales
Shopify Plus Contact: Reach Sales & Support Effectively

Top Luxury Shopify Stores: Design & UX Strategies
How to Improve Customer Experience: A Shopify Roadmap

Creative Facebook Ads: 10 Examples for Shopify Brands

Remarketing with Facebook Ads: A Shopify Guide for 2026

SEO Linking Strategies for Shopify Stores
Top 7 Statistics YouTube Channels for eCommerce in 2026

Hiring Shopify Plus Designers: A Founder's Guide

Shopify Product Variation: Master Your Variants for 2026

Leverage Ai Solutions Brands: Your 2026 Shopify Growth Guide
Filters in Shopify: A Guide for Growing Brands

Shopify Plus Developer: A Guide for Growing Brands

When Does Black Friday Online Start? A 2026 Guide
Black Friday Email Marketing: Shopify & Klaviyo Guide

Polaris Design System: The Complete Shopify Guide

How to Hire a Consultant Email Marketing Expert
What Is Q4? A Shopify Merchant's Guide to Peak Season

Marketing Organization Structure for eCommerce Growth

Top Account-Based Marketing Agency Guide for 2026

7 Remarketing Ad Examples for Your 2026 Campaigns

AI Retail Solutions: Boost Your Shopify Store

Migrate to Shopify: The Definitive 2026 Guide
Shopify Authentication App: A Guide for Secure Stores
Why Strategic Marketing Is Important for Growth in 2026
How to Create a Size Chart in Shopify: 2026 Guide

Shopify Themes for Jewelry: The Definitive 2026 Guide

Minimal Shopify Templates: Faster, Higher-Converting Stores
Maximize Profit: Shopify CC Fees 2026 Guide

Best Shopify Apps for Beginners in 2026

How to Improve Online Shopping Experience in 2026

Shopify Design and Development Services: A 2026 Guide

Small Business Social Media Marketing Agency: A Hiring Guide
Bulk Edit Shopify: A Guide to Save Hours on Store Updates

2026 Trends in Food and Beverage Industry
Post Purchase Survey Guide for Shopify Stores

How to Build an Ecommerce Brand in 2026
Conversion Rate Optimization for Ecommerce: Maximize Profit
How to Use Customer Data to Increase Sales: A Guide

Shopify for Enterprise: The 2026 Deep Dive Guide

Email Marketing Agencies: The Guide for Shopify Brands
Boost Sales With The Right Shipping Shopify App

Your Guide to the Shopify Site Map

7 Headless Commerce Examples for 2026

Mastering Trends in Cosmetic Industry for 2026

Transfer Shopify to BigCommerce The Complete 2026 Playbook

What Is Shopify Collective? Your 2026 Guide to Success

Unlock Shopify Growth with Site Link SEO

Integrating Shopify and WordPress A Complete Guide for 2026

Naming a Clothing Store: A Shopify Founder's Playbook

Guide to buying shopify store in 2026
Buying shopify store: Buying a Shopify Store: Invest Wisely

Food & Beverage Marketing: A Complete Guide for 2026

Facebook Ads Agency: A Shopify Brand's Hiring Guide

Shopify Apparel Stores: A 2026 Launch & Scale Guide
How to Deactivate Shopify Store: The 2026 Guide

Shopify and Square: The 2026 Ultimate Comparison

Your Guide to Beauty Products Ecommerce

A Guide to Marketing for Beauty Brands in 2026
Your Guide to Facebook Black Friday Ads
Facebook Ad Ecommerce for Shopify Growth

Iconography Web Design The Definitive Guide for Shopify Stores

A Modern Backlinks SEO Strategy for Shopify Stores

How to Launch an Online Store: A Step-by-Step Success Guide


newsletter in your inbox