Picture this: your website is a real, brick-and-mortar store. Someone walks through the door, glances at the first display, and immediately walks right back out. They didn't browse an aisle, ask a question, or even look at a price tag.
In the digital world, that's a bounce. It’s a gut reaction, a snap judgment, and a critical signal about a user's first impression of your site.
What Bounce Rate Actually Tells You About Your Website

Simply put, bounce rate is the percentage of visitors who land on one of your pages and leave without doing anything else. No clicks. No form fills. No interaction. Just a single-page visit.
This metric is one of the quickest ways to gauge initial engagement. It helps answer a simple but crucial question: did the page they landed on live up to the promise that brought them there? If the ad they clicked or the search result they saw doesn't align with the actual landing page experience, they're going to hit that "back" button in a heartbeat.
The Core Concept of a Bounce
To get a bit more specific, a bounce isn't just a short visit. It's a session that starts and ends on the very same page, with zero meaningful interactions in between. Analytics platforms like Optimizely track this by looking for a session with only a single engagement hit.
Here’s a quick breakdown of what defines a bounce.
Bounce Rate At a Glance
Any of these scenarios tell the same story: the user's journey on your site ended right where it began.
A high bounce rate often points to a disconnect. It’s a flashing red light indicating that what visitors expected to find and what they actually found are two different things.
Why Initial Impressions Matter
Think of your landing page as your digital handshake. If it's weak, confusing, or irrelevant, the conversation is over before it even has a chance to begin.
A high bounce rate can be a symptom of several problems with that first impression. Maybe your page loads too slowly. Perhaps the design is a confusing mess. Or maybe the content just completely misses the mark on what the visitor was searching for.
On the flip side, a low bounce rate is a fantastic sign. It suggests visitors arrived, liked what they saw, and were intrigued enough to stick around. They clicked on other products, navigated to your blog, or maybe even checked out your contact page. That continued engagement shows you nailed the first impression and delivered on your promise. Understanding this metric is the first step to making sure that crucial first interaction is a good one.
How Bounce Rate Changed from UA to GA4

If you've logged into your analytics and seen your bounce rate numbers looking completely different, you're not imagining things. The switch from Universal Analytics (UA) to Google Analytics 4 (GA4) wasn't just a minor update; it was a total overhaul of how we measure user interaction. This shift completely redefined what "bounce rate" even means.
In the old world of Universal Analytics, a bounce was brutally simple. A user landed on a page, did nothing else, and left. That's it. One page, one session, one bounce. The formula was just as straightforward: divide the number of single-page visits by the total number of visits.
But this had a massive flaw. Think about it. Someone could land on your blog post, spend ten minutes reading every word, find the exact answer they needed, and leave feeling happy. UA would call that a bounce—a failure. It simply couldn't tell the difference between a satisfied one-page visitor and someone who left in disgust after two seconds.
The New Definition in Google Analytics 4
Google Analytics 4 decided to flip the entire concept on its head. Instead of fixating on what users didn't do, GA4 focuses on what they did. The new hero metric is the engaged session.
GA4 counts a session as "engaged" if the visitor does any of these three things:
- Stays on the page for more than 10 seconds (this is the default, but you can change it).
- Triggers a conversion event (like filling out a form or making a purchase).
- Views at least two pages.
This is a much smarter way to look at things. It finally acknowledges that a user can have a meaningful, successful visit even if they only look at one page.
Understanding the GA4 Calculation
With this new focus on positive actions, the way bounce rate is calculated had to change, too. In GA4, bounce rate is simply the inverse of your engagement rate. It’s the percentage of sessions that were not engaged.
Bounce Rate in GA4 = 100% - Engagement Rate
So, if a page has a 75% engagement rate, its bounce rate is automatically 25%. The two metrics are literally two sides of the same coin.
This is exactly why you can't compare your old UA bounce rate data to your new GA4 data. It’s apples and oranges. A 60% bounce rate in UA might have set off alarm bells. But in GA4, a 40% bounce rate is actually great news—it means you have a 60% engagement rate.
What This Means for Your Website
This new approach has big implications for how you analyze your store's performance. The old bounce rate metric sent countless marketers on a wild goose chase, trying to "fix" pages that were doing their job perfectly. A contact page or an FAQ that quickly answers a question should have a high bounce rate under the old model.
Now, the game has changed. The question is no longer, "How do we stop people from leaving?" It's, "How do we get more people to engage?" This leads to much smarter optimization efforts, like:
- Writing better product descriptions to keep people reading past that 10-second mark.
- Making your "Add to Cart" button more obvious to drive conversion events.
- Improving your internal linking to encourage shoppers to view related products.
By wrapping your head around this fundamental shift, you can read your analytics far more accurately. You can finally start making decisions that actually improve the user experience, rather than just chasing a misleading, outdated number.
When a High Bounce Rate Is Actually a Good Sign
It's easy to look at a high bounce rate and immediately think something is broken. While it often points to a problem, context is everything. Sometimes, a high bounce rate means your page is doing its job perfectly, giving the user exactly what they came for in record time.
Think of it like a quick trip to the hardware store for a single screw. You walk in, find the right aisle, grab the screw, pay, and leave. You wouldn't then wander around for 30 minutes just for the sake of it. Your mission was a success. A visitor who lands on a page, gets their answer, and leaves satisfied is a win, even if it adds to your bounce rate statistics.
Scenarios Where Bounces Are a Success
Not all single-page visits are created equal. The trick is to look at the bounce rate through the lens of the page's purpose. Before you jump into "fixing" a page with a lot of bounces, step back and ask: what was the user trying to accomplish here?
Here are a few classic examples where a quick exit is actually a great sign:
- Contact Pages: A customer searches for your phone number, lands on your contact page, finds it, and picks up their phone to call. They got what they needed and bounced. That’s a successful interaction, not a failed one.
- Blog Posts Answering a Specific Question: Someone Googles "how to clean suede shoes." They find your step-by-step guide, read the instructions, and close the tab to go clean their shoes. The page completely nailed their search intent.
- Confirmation or "Thank You" Pages: After a customer subscribes to your newsletter or completes a purchase, they hit a confirmation page. Its job is done. A high exit rate here is expected, and a high bounce rate isn't a red flag.
- Simple Landing Pages: A landing page with one clear call-to-action, like signing up for a webinar, might see users fill out the form and leave immediately. They converted without ever needing to see another page.
A high bounce rate isn’t a sign of a poor page; it’s a sign of a single-page session. The real question is whether that single-page session was successful for the user.
How to Tell Good Bounces from Bad Bounces
So how do you separate the good from the bad? The difference comes down to user intent and whether their needs were met. A bad bounce is when a visitor leaves out of frustration, confusion, or because the page wasn't what they expected. A good bounce is when they leave because their goal was accomplished.
To figure out which is which, you have to look beyond the bounce rate metric itself. Dig a little deeper and consider these factors:
- Time on Page / Engagement: In the old days of Universal Analytics, a high time-on-page paired with a high bounce rate often meant people were actually reading. In GA4, this concept has evolved into engaged sessions. A visit lasting over 10 seconds is now considered a success, which gives you a much clearer picture.
- Conversion Goals: Did the user do what you wanted them to do, even if it was off-site? If the goal of your contact page is to generate phone calls, a bounce isn't a failure.
- Page Type: As we've covered, the purpose of a blog post is worlds apart from a product category page. You have to judge the metric based on what that specific page is designed to achieve.
By understanding these nuances, you can stop wasting time trying to "fix" pages that are already working beautifully. Instead, you can channel all that energy into the pages where a high bounce rate is genuinely screaming that something is wrong with the user experience.
Understanding Bounce Rate Benchmarks by Industry
Trying to pin down a single "good" bounce rate is a fool's errand. It's like asking if 70 degrees is warm—it all depends on where you are. In San Francisco, 70°F is a perfect day. In Antarctica, it’s a full-blown heatwave. The same logic applies here; what's considered a fantastic bounce rate for an eCommerce store could be a red flag for another kind of website.
Context is absolutely everything. You simply can't measure your site's performance against some universal number. Why? Because visitor goals and expectations are wildly different from one industry to the next, and that directly shapes how they behave on your pages.
Why Bounce Rates Vary So Much
At the heart of it all is user intent. Someone landing on a clothing store's website is there to browse. They're wired to click from category pages to product pages, maybe even check out a "New Arrivals" section. Their goal is a journey, so you'd expect a nice, low bounce rate.
Now, flip the script. A user clicks a headline from social media, lands on a news article, reads it, and leaves. Mission accomplished. They got exactly what they came for from that one page, so a high bounce rate is not only normal—it's expected.
This flowchart paints a clear picture of how a page's purpose—be it a blog post, a contact form, or a sign-up page—shapes what a "good" bounce rate really looks like.
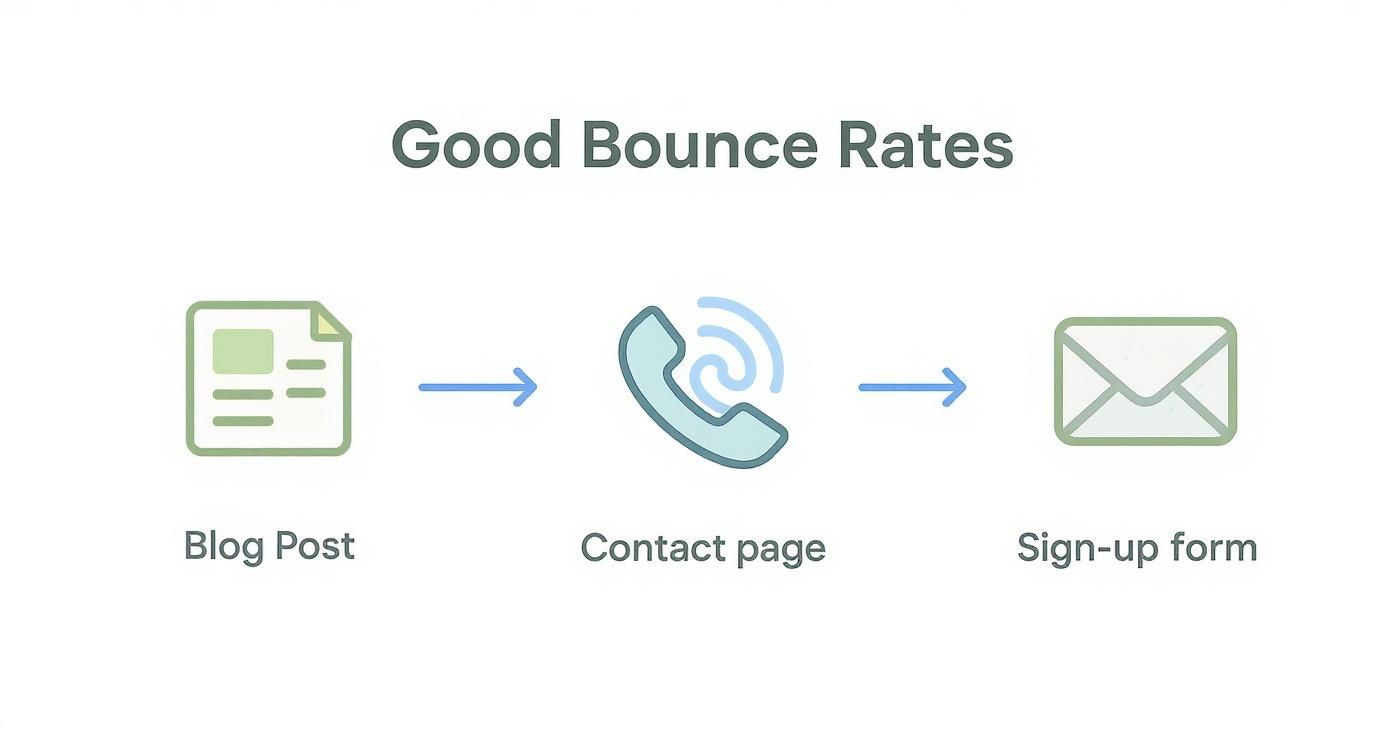
As you can see, pages designed for one specific, quick action can be wildly successful even when a user "bounces." They came, they saw, they got what they needed.
Comparing Averages Across Key Sectors
To set goals that actually make sense, you have to look at your peers. Stacking your site up against others in your field is the only way to get a realistic read on performance. Data consistently shows that user behavior changes dramatically depending on the industry.
Here's a look at some typical bounce rates to give you a clearer frame of reference.
Average Bounce Rate by Industry
A comparative look at typical bounce rates across various sectors to provide context for website performance.
Note: These ranges are general estimates and can fluctuate based on traffic source, device, and specific business model.
This table shows exactly why you shouldn't panic if your blog's bounce rate is hovering around 75% while a competing eCommerce store is bragging about its 40% rate. Their definitions of success are just fundamentally different.
A benchmark isn’t a finish line; it’s a starting point. It gives you a realistic frame of reference to begin analyzing your own data and identifying true opportunities for improvement.
How to Use Benchmarks Effectively
Once you know where your industry generally lands, you can start evaluating your own site's performance with a much sharper eye. Instead of chasing some arbitrary low number, you can get down to meaningful analysis.
Start using these benchmarks to ask more strategic questions:
- How do we stack up? Is our bounce rate way higher or lower than the industry average?
- Where are the problem spots? Do we have specific pages that perform much worse than our site-wide average?
- What was the visitor trying to do? For those pages with high bounce rates, is the page actually fulfilling its purpose, or is there a clear disconnect?
By grounding your analysis in real-world data from your own sector, you can finally move from asking, "What's a good bounce rate?" to the much more powerful question: "What's a good bounce rate for us?" That shift is the key to turning raw numbers into an actionable strategy that actually grows your business.
Actionable Strategies to Reduce Your Bounce Rate
Alright, you know what bounce rate is and where your store stands. Now for the important part: turning that data into action. Lowering your bounce rate isn't about chasing some vanity metric; it's about fixing the friction points that make people leave, leading to a better user experience that keeps them around and, ultimately, encourages them to buy.
This isn't a guessing game. It's about a methodical process of finding what's broken and making targeted improvements. The following strategies are tried-and-true ways to make your pages more engaging and give visitors a reason to make that all-important second click.
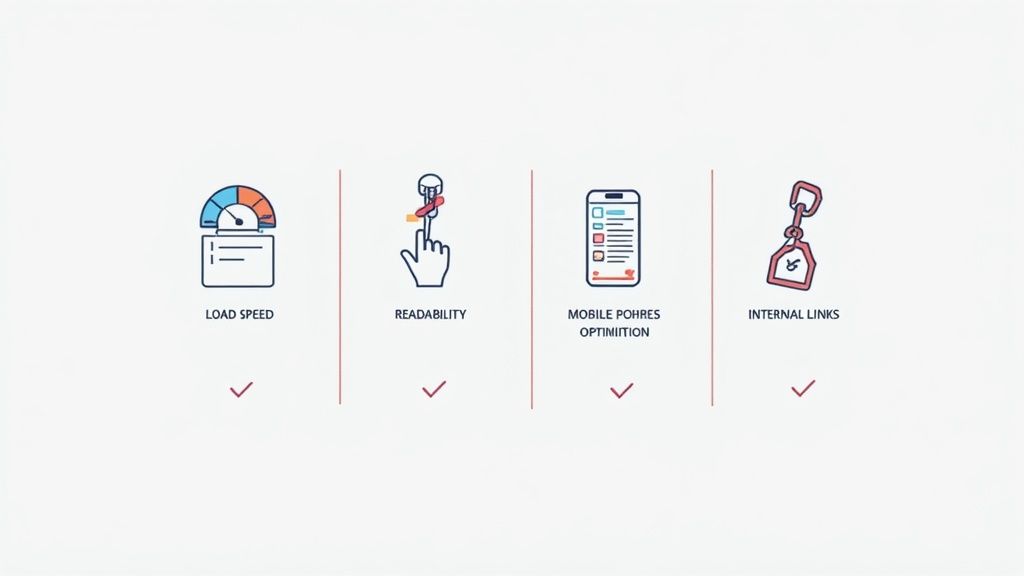
Supercharge Your Page Load Speed
In a world of instant everything, a slow website is an absolute engagement killer. Nothing sends visitors scrambling for the back button faster than a page that takes forever to load. In fact, page speed is one of the single biggest factors influencing whether someone stays or bounces.
Your goal? Get your pages loading in under 3 seconds on mobile and under 2 seconds on desktop. Anything more than that is just asking for people to leave before they even see what you have to offer.
Here are a few key things to focus on right away:
- Optimize Your Images: Huge, uncompressed images are the usual suspects. Use modern formats like WebP and run them through compression tools to shrink file sizes without wrecking the quality.
- Leverage Browser Caching: This tells a visitor's browser to save static files (like your logo and CSS) locally. When they come back, the site loads way faster.
- Minimize Code: Clean up your CSS, JavaScript, and HTML. Removing extra spaces and unnecessary characters makes the files lighter and quicker to download.
Align Your Content with User Intent
The number one reason for a bounce is a mismatch between what someone expected and what they found. When a user clicks a link from Google, an ad, or social media, they have a very specific goal in mind. If your page doesn't instantly solve their problem or answer their question, they're gone.
You absolutely have to deliver on the promise you made in your page title, meta description, or ad copy.
A user lands on your page with a silent question: "Am I in the right place?" Your content in the first few seconds must be a resounding "Yes!"
A great way to nail this is to analyze the top-ranking pages for your target keywords. What are they doing? Is it a step-by-step guide? A product grid? A simple Q&A? Match the format and depth of your content to what users are clearly looking for.
Enhance Content Readability and Structure
Nobody likes being greeted by a massive wall of text. It's intimidating. Visitors scan pages looking for information, and if your content is a dense, unorganized mess, they'll bounce out of pure frustration. Making your content easier to read is a simple but incredibly powerful way to keep people engaged.
Break up your content with some smart formatting to make it scannable and easy to digest.
- Use Short Paragraphs: Seriously, keep them to 1-3 sentences.
- Write Clear Subheadings (H2, H3): These act as signposts, guiding readers through the content and letting them jump to the sections they care about most.
- Incorporate Bullet Points and Numbered Lists: They're perfect for breaking down features, steps, or key takeaways into bite-sized chunks.
- Add Visuals: Relevant images, charts, and even short videos help explain concepts and create much-needed visual breaks.
These small tweaks make your content feel more approachable and help visitors find value without having to work for it.
Optimize the Mobile User Experience
Mobile traffic is king now, but a shocking number of stores still provide a clunky, frustrating experience on smaller screens. There's a reason mobile bounce rates are almost always higher than desktop—people are less patient and have zero tolerance for poor design on their phones.
Your site needs to be fully responsive, but true mobile optimization goes deeper. Buttons and links need to be big enough to easily tap with a thumb. Menus should be simple and intuitive. Forms have to be a breeze to fill out.
By tackling the core issues that cause high bounce rates, you'll often find yourself fixing the same problems that lead to abandoned carts. For example, a clear and simple checkout process is key to both keeping users engaged and learning how to reduce shopping cart abandonment. It's all about creating a seamless experience.
Strengthen Your Internal Linking Strategy
One of the best ways to kill a bounce is to give your visitors a compelling reason to click through to another page on your site. A smart internal linking strategy turns a dead-end page into a launchpad for further exploration.
But don't just throw links in randomly. You have to be strategic.
- Use Descriptive Anchor Text: The clickable text should tell the user exactly what they'll get. Instead of "click here," use something like "explore our collection of leather jackets."
- Link to Relevant, High-Value Content: Point users toward your best blog posts, related product categories, or case studies that add real value to what they're reading.
- Place Links Naturally: Your links should feel like a helpful next step in their journey, not a pushy sales pitch.
Every internal link is an opportunity to keep the conversation going and pull that user deeper into your brand's world. For an even more detailed guide, check out our post on how to reduce bounce rate. Even putting a few of these tips into practice can make a huge difference in your engagement and lead to a much healthier bounce rate.
How to Diagnose High Bounce Rate Pages
Before you can even think about fixing a high bounce rate, you have to put on your detective hat. Just knowing the number is high doesn’t help. You need to dig deeper to pinpoint exactly which pages are the problem and why visitors are hitting the back button.
This whole process is about turning a vague problem ("our bounce rate is high") into a specific, solvable one.
Your first stop is your analytics tool, most likely Google Analytics. Head straight to your pages report and sort the bounce rate column from highest to lowest. This gives you a quick list of your worst offenders, but don't stop there. Context is everything. A page with 10,000 visits and an 80% bounce rate is a five-alarm fire compared to a page with just 50 visits and a 90% bounce rate. Focus on the high-impact pages first.
With your priority list in hand, the real investigation starts. It’s time to slice and dice your data to find the hidden stories. Analyzing your website traffic this way is how you uncover the real root cause.
Isolate the Root Cause with Segmentation
Segmentation is your secret weapon. It lets you break down your audience into smaller groups to see how they behave differently on the same page. This is where you’ll find your "aha!" moments. Start asking questions and use filters in your reports to get the answers.
- Traffic Source: Are people from organic search bouncing way more than visitors from your email list? That could mean your page content doesn’t match what your meta description promised in the search results.
- Device Type: Is the bounce rate through the roof on mobile but perfectly fine on desktop? This is a classic symptom of a poor mobile experience. Think slow load times, tiny text, or buttons that are impossible to tap.
- Browser: Does the page work beautifully in Chrome but has a sky-high bounce rate in Safari? You might be looking at a browser-specific bug or a weird rendering issue.
By layering these segments on top of each other, you can get incredibly specific. You might find that your high bounce rate is almost entirely coming from mobile users on Safari who clicked through from a Facebook ad. Now that's a problem you can solve.
Go Beyond Analytics with User Behavior Tools
Analytics tells you what happened, but user behavior tools show you why. These visual tools are the final piece of the puzzle, essentially letting you look over your user’s shoulder as they browse your site.
Tools like Hotjar or Microsoft Clarity give you insights you just can't get from numbers alone:
- Heatmaps: These create a visual map of where users click, where they move their mouse, and how far down the page they actually scroll. A heatmap might show you that everyone is trying to click on an image that isn't a link, or that nobody is scrolling far enough to see your main call-to-action.
- Session Recordings: This is the goldmine. You can watch anonymous recordings of real people using your site. See them get frustrated and "rage-click" a broken button, get lost in your navigation, or just scroll up and down looking totally confused. It’s the most direct way to spot friction.
When you combine the hard numbers from Google Analytics with the visual, qualitative insights from these tools, you're no longer guessing. You'll have a clear, data-driven diagnosis of why people are leaving, giving you the power to make changes that actually move the needle.
Even after you get the hang of bounce rate, a few questions always seem to surface. Let's clear up some of the most common points of confusion you'll run into.
What’s the Difference Between Bounce Rate and Exit Rate?
This is a classic one, but the distinction is pretty simple when you think about it.
Think of bounce rate as an entrance problem. It's all about first impressions. A user lands on a page from an external source (like Google or a social media link) and leaves without doing anything else. That one-and-done visit is a bounce, and it only ever applies to the first page they see.
Exit rate, on the other hand, is a departure metric. It tells you which page was the last one someone saw before leaving your site, no matter how many other pages they visited first. Someone could browse five pages and then leave from your shipping policy page. That page gets an "exit," but no page gets a "bounce" because it was a multi-page session.
Does Bounce Rate Directly Impact SEO Rankings?
Straight from the source: Google has said that bounce rate is not a direct ranking factor. But don't dismiss it just yet.
While it won't single-handedly tank your rankings, it’s a powerful indirect signal. A sky-high bounce rate is a huge red flag that your content isn't hitting the mark for what users are searching for. Search engines are obsessed with user satisfaction. If people are constantly landing on your page and immediately hitting the back button, it tells Google your page isn't a good answer to their query. Over time, that poor user experience can absolutely hurt your SEO performance.
Key Takeaway: Don't fixate on bounce rate as a direct SEO metric. Instead, treat it as a symptom. A high bounce rate points to bigger problems—like poor user experience or a mismatch between your content and user intent—that will harm your SEO.
How Do I Find Bounce Rate in Google Analytics 4?
You might have noticed bounce rate is missing from the standard reports in Google Analytics 4. They've tucked it away, but bringing it back is a piece of cake.
Here’s how you add it to your reports:
- Head over to Reports > Engagement > Pages and screens.
- Click the little pencil icon in the top-right corner to Customize report.
- Choose Metrics, then click Add metric.
- Just search for Bounce rate and select it.
- Click Apply, and you're all set. I'd recommend dragging it near the top of the list so it's easy to spot.
And remember, the new GA4 bounce rate is simply the inverse of your engagement rate. If you have a 25% bounce rate, that means you have a 75% engagement rate.
At ECORN, we do more than just read the data—we translate these analytics insights into real-world strategies that grow your Shopify store. From fine-tuning the user experience to building a conversion machine, our team is here to help you scale. Explore our tailored Shopify solutions and see how we can level up your eCommerce game.


Clean Website Design: A Shopify Conversion Playbook

Omnichannel Retail Strategy: A Shopify Playbook
Product Data Enrichment: A Guide for Shopify Brands

Instagram Shopping Features a Guide for Shopify Stores
What Is Revenue Optimization: A Holistic RevOps Guide
Benefits of Conversion Rate Optimization: Boost Your
WordPress to Shopify Migration: Your 2026 Seamless Switch
Boost Sales: Ecommerce Payment Processing Guide 2026

Unified Commerce Platform: Benefits, KPIs & Shopify Guide
How to Reduce Bounce Rate eCommerce: Your 2026 Guide
Shopify API Integration: A Practical End-to-End Guide

How to Implement Data Governance: A 2026 Guide
Shopify Store Development Cost: A 2026 Breakdown
What Is Server Side Tracking: The Shopify Guide 2026
Marketing Automation Workflows: A Shopify Guide for 2026

Shopify: How to Reduce Technical Debt

Shopify UX Design Change: A Playbook for Growth
User Generated Content Strategy: Shopify Playbook

Shopify Pause and Build Plan Cost: A Complete 2026 Guide
Compare at Price on Shopify: A Complete Guide for 2026

Where Can I Sell My Prints? 10 Best Platforms for 2026
Shopify Order Management System: The Ultimate Guide 2026
What Is Marketing Attribution? an eCommerce Guide for 2026

10 Best Black Friday Sales Sheets for 2026

Discover the Top Social Media Marketing Agencies For
Consumer Confidence Definition for eCommerce in 2026
What Is Social Commerce? Your 2026 Guide to Boosting Sales

A Social Ad Campaign Playbook for eCommerce Growth

7 Best FAQ Page Examples for SaaS & eCommerce

Market Research in Fashion Industry: A Guide for Shopify

Shopify Migration Services: Expert Guide for 2026

Mastering FB Retargeting Ads for Shopify in 2026
What Is Omnichannel Ecommerce

Master Your Shopify Plus Migration: The 2026 Guide
Shopify Integration Services: A Merchant's 2026 Guide
Shopify Collection Description: A Guide to SEO & Sales

Shopify Plus Contact: Reach Sales & Support Effectively

Top Luxury Shopify Stores: Design & UX Strategies
How to Improve Customer Experience: A Shopify Roadmap

Creative Facebook Ads: 10 Examples for Shopify Brands

Remarketing with Facebook Ads: A Shopify Guide for 2026

SEO Linking Strategies for Shopify Stores
Top 7 Statistics YouTube Channels for eCommerce in 2026

Hiring Shopify Plus Designers: A Founder's Guide

Shopify Product Variation: Master Your Variants for 2026

Leverage Ai Solutions Brands: Your 2026 Shopify Growth Guide

Filters in Shopify: A Guide for Growing Brands

Shopify Plus Developer: A Guide for Growing Brands

When Does Black Friday Online Start? A 2026 Guide
Black Friday Email Marketing: Shopify & Klaviyo Guide

Polaris Design System: The Complete Shopify Guide

How to Hire a Consultant Email Marketing Expert
What Is Q4? A Shopify Merchant's Guide to Peak Season

Marketing Organization Structure for eCommerce Growth

Top Account-Based Marketing Agency Guide for 2026

7 Remarketing Ad Examples for Your 2026 Campaigns

AI Retail Solutions: Boost Your Shopify Store

Migrate to Shopify: The Definitive 2026 Guide

Shopify Authentication App: A Guide for Secure Stores
Why Strategic Marketing Is Important for Growth in 2026
How to Create a Size Chart in Shopify: 2026 Guide

Shopify Themes for Jewelry: The Definitive 2026 Guide

Minimal Shopify Templates: Faster, Higher-Converting Stores
Maximize Profit: Shopify CC Fees 2026 Guide

Best Shopify Apps for Beginners in 2026

How to Improve Online Shopping Experience in 2026

Shopify Design and Development Services: A 2026 Guide

Small Business Social Media Marketing Agency: A Hiring Guide
Bulk Edit Shopify: A Guide to Save Hours on Store Updates

2026 Trends in Food and Beverage Industry
Post Purchase Survey Guide for Shopify Stores

How to Build an Ecommerce Brand in 2026
Conversion Rate Optimization for Ecommerce: Maximize Profit
How to Use Customer Data to Increase Sales: A Guide

Shopify for Enterprise: The 2026 Deep Dive Guide

Email Marketing Agencies: The Guide for Shopify Brands
Boost Sales With The Right Shipping Shopify App

Your Guide to the Shopify Site Map

7 Headless Commerce Examples for 2026

Mastering Trends in Cosmetic Industry for 2026
Transfer Shopify to BigCommerce The Complete 2026 Playbook

What Is Shopify Collective? Your 2026 Guide to Success

Unlock Shopify Growth with Site Link SEO

Integrating Shopify and WordPress A Complete Guide for 2026

Naming a Clothing Store: A Shopify Founder's Playbook

Guide to buying shopify store in 2026

Buying shopify store: Buying a Shopify Store: Invest Wisely

Food & Beverage Marketing: A Complete Guide for 2026
Facebook Ads Agency: A Shopify Brand's Hiring Guide
Shopify Apparel Stores: A 2026 Launch & Scale Guide
How to Deactivate Shopify Store: The 2026 Guide

Shopify and Square: The 2026 Ultimate Comparison

Your Guide to Beauty Products Ecommerce

A Guide to Marketing for Beauty Brands in 2026
Your Guide to Facebook Black Friday Ads
Facebook Ad Ecommerce for Shopify Growth

Iconography Web Design The Definitive Guide for Shopify Stores

A Modern Backlinks SEO Strategy for Shopify Stores

How to Launch an Online Store: A Step-by-Step Success Guide
Optimize Shopify Store: Master Performance in 2026


newsletter in your inbox