
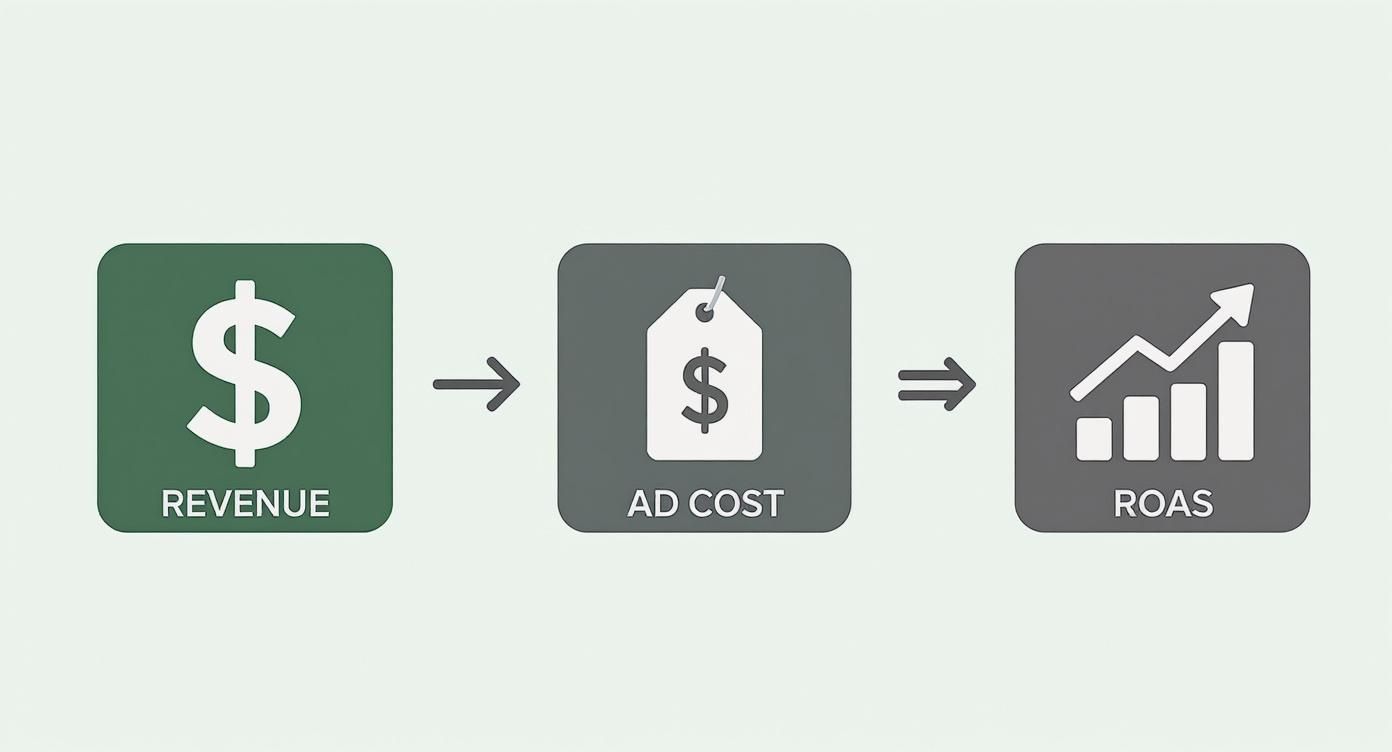
To figure out your return on ad spend, you just divide the total revenue your ad campaign brought in by how much you spent on it. The number you get back—often shown as a ratio like 4:1—tells you exactly how many dollars you earned for every single dollar you spent. It’s the go-to metric for seeing the direct financial punch of your advertising.
What Return on Ad Spend Really Means
Before you get lost in spreadsheets, it’s important to understand the story ROAS is telling you. At its core, Return on Ad Spend is a refreshingly simple measure of how much gross revenue your ad campaign generated. It answers one of the most critical questions in marketing: "Are my ads actually making more money than they cost?"
Think of it as the most direct line you can draw between your marketing budget and your sales numbers. While other metrics like click-through rates and impressions have their place, ROAS cuts straight to the financial outcome. That’s why it’s a non-negotiable KPI for any marketer who needs to prove a campaign’s worth and make a solid case for future ad budgets.
The Core Formula Explained
The formula itself is pretty straightforward: ROAS = Revenue from Ad Campaign / Cost of the Ad Campaign. This little equation is all about measuring how effective each dollar you spend on advertising really is.
Let's say a campaign costs you $10,000 and pulls in $50,000 in revenue. Your ROAS would be 5.0, which means you earned $5 for every $1 you spent. In the marketing world, a 4:1 ratio is often seen as a solid benchmark for profitable advertising, but honestly, what’s considered "good" can really vary by industry and profit margins.
To quickly see how these pieces fit together, here's a simple breakdown.
The ROAS Formula at a Glance
This table sums up the essential components you'll need to plug into the ROAS formula.
Ultimately, having these numbers handy makes the calculation quick and painless.
ROAS is more than just a number; it's a compass for your marketing strategy. It guides budget allocation, helps identify high-performing campaigns, and flags underperforming ads that need immediate attention.
Why ROAS Is a Key Performance Indicator
Knowing how to calculate and interpret ROAS is fundamental because it directly shapes your business decisions. It serves a few crucial functions:
- Budget Justification: A strong ROAS is the clearest evidence you can show stakeholders that the marketing budget is delivering real, tangible results.
- Campaign Optimization: By comparing the ROAS across different campaigns, channels, or even individual ads, you can intelligently shift your resources toward what's actually working.
- Strategic Planning: It helps map out future marketing strategies by showing you which types of campaigns are the most profitable for your specific business.
ROAS is a cornerstone metric in the broader world of results-driven advertising. To get a better feel for this landscape, it's worth exploring what performance marketing is all about. This approach is built on tying advertising costs directly to measurable outcomes, which makes ROAS a central pillar of success.
A Practical Guide to Calculating Your ROAS
Alright, let's get down to brass tacks. Knowing the formula for ROAS is great, but the real magic happens when you can apply it to your own numbers. The equation itself is simple, but the two main ingredients—revenue and cost—can be surprisingly tricky.
If you miscalculate either one, you'll end up with a skewed ROAS, and that can lead to some really bad business decisions. Getting this right is everything.
This flow chart gives you the bird's-eye view.
At its heart, you're just dividing the money your ads brought in by what you spent to run them. The devil, as always, is in the details.
Identifying True Campaign Revenue
First up is revenue. This seems easy enough—just peek at your sales dashboard, right? Not so fast. The key here is attribution. You have to be confident that the sales you're counting were directly caused by your ad campaign, within whatever attribution window you've set.
For example, if an e-commerce brand is running a Google Shopping campaign for a new line of sneakers, they can't just look at all sneaker sales. They need to isolate the total sales value generated specifically from clicks on those ads. It’s all about drawing a straight line from an ad click to a completed purchase.
Uncovering Your Total Ad Cost
This is the part where so many marketers trip up. Your "Total Ad Cost" is almost never just the bill you get from Google or Meta. A truly accurate calculation ropes in every single expense that went into making that campaign a reality. If you don't, you're just giving yourself an ego boost with an inflated ROAS.
Your all-in ad cost needs to include:
- Platform Spend: The obvious one. This is what you paid directly to the ad network.
- Agency or Freelancer Fees: If you've hired help, their monthly retainer or project fees are a direct cost of the campaign.
- Creative Production: Don't forget what it cost to make the ads. This covers graphic design, video editing, and copywriting.
- Management Tools: Any software you pay for—whether it's for analytics, optimization, or campaign management—needs to be factored in.
Ignoring these "soft costs" gives you a dangerously incomplete picture. To get an even more granular look at campaign expenses, you can also check out our guide on how to calculate cost per acquisition.
An accurate ROAS is built on honest accounting. If a cost was necessary to run the campaign, it belongs in your calculation. A slightly lower, but truthful, ROAS is far more valuable than an impressive but inaccurate one.
Putting It All Together: A Real Example
Let's walk through a scenario. Imagine a Shopify store that sells handmade leather goods. They decide to run a Facebook ads campaign for one month, and here are their numbers:
- Revenue from Ads: $15,000
- Facebook Ad Spend: $2,500
- Agency Management Fee: $1,000
- Ad Creative Design Cost: $500
First, we need to find the true total ad cost: $2,500 + $1,000 + $500 = $4,000.
Now, we just plug that into our ROAS formula: $15,000 (Revenue) ÷ $4,000 (Total Cost) = 3.75.
So, for every $1 they actually invested in this campaign, they brought back $3.75 in revenue. This 3.75:1 ROAS is a real, actionable number they can use to measure performance against their goals and, most importantly, their profit margins.
What Is a Good ROAS for Your Business?
Once you’ve got your ROAS calculated, the next question is always the same: "Is this number any good?"
I wish I could give you a single magic number that guarantees success, but the truth is, there isn't one. The real (and slightly frustrating) answer is: it depends.
A "good" ROAS is completely relative. It’s shaped by your industry, your business model, and most critically, your profit margins. What’s a home run for one company could be a complete disaster for another.
For example, a software company with juicy 80% margins would be ecstatic with a 3:1 ROAS. Every dollar they spend brings back three, leaving a ton of profit on the table. But for a low-margin e-commerce store selling t-shirts, that same 3:1 ROAS might not even cover the cost of the shirt, shipping, and packaging. They'd be losing money on every sale.
Your Profit Margin Sets the Stage
Before you can decide on a target ROAS, you have to know your profit margin inside and out. This is the single most important piece of the puzzle because it determines your break-even ROAS—the absolute minimum you need to make back just to cover your costs.
Anything above that break-even point is pure profit.
Think about these different business types:
- High-Margin Businesses: Digital products, software, info courses, or luxury goods. They can often be profitable with a lower ROAS.
- Low-Margin Businesses: Common in retail, dropshipping, or consumer packaged goods. These businesses need a much higher ROAS to make any real money.
The goal isn't just to generate revenue; it's to generate profitable revenue. Your ROAS target must be high enough to cover not just the ad spend but all the associated costs of delivering your product or service.
Getting this right is more important than ever. Global ad spending is on track to smash $1 trillion in 2025, a massive jump from $384 billion back in 2011. With digital channels now eating up over 72.7% of that pie, you can't afford to guess. You can see more of these global advertising trends on DataReportal.
To give you a clearer picture, here’s how different business models might approach their ROAS targets.
Sample ROAS Targets by Business Model
This table shows how profit margins directly influence what a "good" ROAS looks like. A business with thin margins needs a much higher return to stay profitable and fuel growth compared to one with a lot of built-in profit.
Notice the huge difference between a SaaS company and a dropshipper. The dropshipper needs a stellar 10:1 or higher just to have a healthy, growing business, while the SaaS company can thrive on a 3:1.
Beyond the First Sale: Customer Lifetime Value
Here’s another layer to add to your thinking: Customer Lifetime Value (CLV).
Sometimes, a ROAS that looks mediocre on the first purchase is actually a brilliant investment. Why? Because that customer might stick around and make several more purchases over the next few years.
This is especially true for subscription businesses or brands that build intense customer loyalty. The initial ad campaign isn't just about that first sale; it's the cost of acquiring a long-term, high-value relationship.
Ultimately, your ideal ROAS has to align with your bigger business goals. Are you in a hyper-growth phase trying to grab market share, or are you focused on maximizing immediate profitability? Answering that will help you define what "good" really means for you. This is a key part of any solid growth strategy, and you can dive deeper in our guide on how to calculate customer lifetime value.
Remember, your target ROAS isn't set in stone. It's a living metric that should evolve as your business and its goals change over time.
Why a High ROAS Can Be Misleading
It’s so easy to get a rush when you see a high ROAS figure pop up on your dashboard. A 5:1 or even a 10:1 return feels like a massive win, but that single metric doesn't come close to telling the full story.
In fact, blindly chasing a high ROAS without understanding the bigger picture can lead you down a surprisingly unprofitable path.
The core issue is that ROAS measures gross revenue, not actual profit. It tells you how much money your ads brought in, but it completely ignores all the other costs that go into actually delivering your product or service.
This is a classic trap. I’ve seen it happen time and time again: a campaign can have a fantastic ROAS and still be losing the company money with every single sale. To get a real pulse on your financial health, you have to look beyond ROAS and consider the much broader metric of Return on Investment (ROI).
The Critical Difference Between ROAS and ROI
Think of ROAS as a campaign-level report card. It’s hyper-focused on how efficient your ads are. ROI, on the other hand, is the business-level report card that measures overall profitability. It's the one your accountant actually cares about.
To get a true sense of performance, you need to account for all the costs that ROAS blissfully ignores:
- Cost of Goods Sold (COGS): The direct cost of producing the product you sold.
- Shipping and Fulfillment: All the expenses for packing and mailing the order.
- Operational Overhead: Things like employee salaries, software subscriptions, and other general business costs.
- Payment Processing Fees: That percentage skimmed off the top by platforms like Stripe or PayPal.
When you start factoring in these very real expenses, a seemingly great ROAS can fall apart fast. This is why knowing how to calculate return on ad spend is just the first step; putting that number in context with your profit margin is what truly matters.
A high ROAS on a low-margin product can be a recipe for disaster. You might be celebrating impressive revenue figures while your bank account is slowly draining. Always connect your ad performance back to your bottom line.
When Good Numbers Go Bad: A Real-World Scenario
Let's walk through an example. Imagine an e-commerce store selling custom-printed hoodies. They launch a new ad campaign and hit what looks like a solid 4:1 ROAS. For every $100 they put into ads, they generate $400 in revenue. On the surface, this looks great.
But let’s break down the actual costs behind those sales:
- Ad Spend: $100
- Cost of Hoodies (COGS): $200
- Shipping & Packaging: $75
- Payment Processing Fees: $12
Suddenly, the total cost to generate that $400 in revenue wasn't just the $100 ad spend—it was actually $387. This leaves them with a real profit of a meager $13. The campaign is technically profitable, but it’s operating on razor-thin margins that leave zero room for error.
This is why looking at ROAS in a vacuum is so dangerous. For example, some aggregated client data showed a company with a ROAS of 2.13, but after factoring in marketing support and overhead, its actual ROI was only 6.7%. As you can see from these ROAS statistics and insights from First Page Sage, this disconnect is common. A holistic view isn't just nice to have; it's essential.
Actionable Strategies to Improve Your ROAS
Knowing your ROAS is a great start, but the real goal is to make that number climb. Improving your return on ad spend really just boils down to two simple levers: you can either increase the revenue your ads generate, or you can decrease what it costs to run them. Simple, right?
Let's get into a tactical playbook you can use to start boosting your numbers. Forget the generic advice—we’re talking specific, actionable strategies that actually work.

Each of these tips is designed to directly impact your ROAS formula, either by driving more revenue or by making your ad spend way more efficient.
Refine Your Audience Targeting
The absolute fastest way to burn through your ad budget is by showing ads to the wrong people. It’s a common mistake, but a costly one. The more precise your targeting, the less money you waste on clicks that will never, ever convert. Your goal is to get your message in front of an audience that isn't just interested, but is actually ready to buy.
Here are a few ways to sharpen your targeting:
- Leverage Lookalike Audiences: Upload a list of your best customers and let platforms like Meta or Google find new people with similar behaviors and interests. This is often a goldmine for finding high-intent buyers you wouldn't have found otherwise.
- Drill Down with Demographics and Interests: Go beyond broad categories. Instead of targeting "fitness enthusiasts," get granular. Try something like "women aged 25-34 who are interested in yoga and follow Lululemon." The difference in quality can be massive.
- Utilize Retargeting: A staggering 97% of first-time website visitors leave without making a purchase. A well-crafted retargeting campaign brings them back to finish what they started, which almost always results in a much higher conversion rate and a better ROAS.
Eliminate Wasted Spend with Negative Keywords
One of the most powerful—and strangely underutilized—strategies for improving ROAS is the aggressive use of negative keywords. These are simply terms you add to your campaign to prevent your ads from showing up for irrelevant searches.
For instance, if you sell high-end "leather briefcases," you definitely don't want to be paying for clicks from people searching for "cheap faux leather briefcases" or "how to repair a leather briefcase." Every single one of those clicks is just wasted money.
Think of negative keywords as your campaign's bouncer. They stand at the door and turn away unqualified traffic, ensuring only the most relevant potential customers get in. This directly cuts your ad cost without sacrificing a penny of potential revenue.
Taking the time for mastering negative keywords for Google Ads can directly prevent that wasted ad spend and give your ROAS a significant boost. Make it a habit to regularly review your search term reports to find and add new negative keywords to your list.
Optimize Your Landing Pages for Conversion
You can have the most compelling ad in the world, but if it leads to a slow, confusing, or untrustworthy landing page, you’ve lost the sale. It's a classic fumble at the goal line. Your ad makes a promise, and the landing page must deliver on it seamlessly.
A high-converting landing page is an absolutely critical piece of a healthy ROAS. Focus on these key areas:
- Message Match: The headline and imagery on your landing page need to directly mirror the ad the user just clicked. That consistency builds immediate trust and keeps people from bouncing right off your page.
- Page Load Speed: Every second counts. Seriously. A one-second delay in page load time can slash conversions by 7%. Compress your images and simplify your page design to make sure it loads almost instantly.
- Clear Call-to-Action (CTA): Make it painfully obvious what you want the visitor to do next. Use a contrasting color for your CTA button and compelling, action-oriented text. "Get Your Free Quote" is always better than a generic "Submit."
By methodically refining your targeting, plugging budget leaks with negative keywords, and ensuring your landing pages are built to convert, you actively improve both sides of the ROAS equation. This leads to much more efficient spending and, ultimately, more profitable campaigns.
Common Questions About ROAS Answered
Even after you get the hang of calculating your return on ad spend, a few questions always seem to come up. Let’s tackle some of the most common points of confusion head-on.
Think of this as your quick-reference guide. Getting these details right will help you talk about your campaign performance with confidence and make smarter decisions.
ROAS vs. ROI: What’s the Difference?
This is easily the most common mix-up. While ROAS and ROI both measure returns, they tell you two completely different stories about your business's financial health.
- Return on Ad Spend (ROAS) is a campaign-level metric. It specifically measures the gross revenue you generate for every single dollar you spend on advertising. It’s a laser-focused look at ad efficiency.
- Return on Investment (ROI) takes a much bigger-picture view. It calculates the total net profit from an investment after you subtract all the associated costs—not just ad spend, but also things like the cost of goods sold, shipping, and overhead.
Simply put: ROAS is for your ads. ROI is for your business.
Which Costs Should I Include in Ad Spend?
For your ROAS calculation to be worth anything, it has to be accurate. That means you need to include every single cost directly tied to running your campaigns. It’s tempting to just plug in the media spend from Google or Meta, but that will only give you an inflated, misleading number.
A complete ad spend figure includes:
- The actual ad spend paid to the platforms (Google, Meta, etc.).
- Any agency fees or freelancer retainers for managing the campaigns.
- The cost of creating your ad assets—think graphic design, video production, or copywriting.
- Subscriptions for any tools you use to manage, analyze, or optimize the campaign.
A ROAS below 1.0 is a blaring alarm that your campaign is losing money. For example, a 0.80 ROAS means you’re only generating 80 cents in revenue for every dollar spent. That’s a straight-up 20% loss on your ad budget.
How Do I Track ROAS for Long Sales Cycles?
This is a great question, especially for B2B services or brands selling high-ticket items where a customer might not buy for weeks or even months. The trick here is moving beyond the ad platform's default dashboard.
The key is to connect your advertising platforms to a solid CRM system.
This setup lets you trace a lead from their very first ad click all the way through to the final sale, no matter how much time passes. By using more sophisticated attribution models in your analytics—like time-decay or data-driven models—you can assign proper credit to the ads that influenced that sale over time. This gives you a true picture of your campaigns' long-term value, not just the immediate conversions.
At ECORN, we specialize in turning these numbers into scalable growth for Shopify brands. Our team of experts can help you optimize your campaigns to not just improve your ROAS, but to drive real, sustainable profit. Learn more about our Shopify solutions.


Critical Rendering Path: A Guide for Shopify Stores

How to Promote on TikTok for eCommerce in 2026

B2B eCommerce Consulting That Drives Real Revenue
10 Best Practices for Site Navigation in 2026
Return vs Refund for Shopify Stores: A Practical Guide
What Is Customer Lifetime Value and Why It Matters
What Is Voice of Customer Research for eCommerce

SMS Marketing for Ecommerce That Actually Converts

Master How to Improve Email Deliverability in 2026

Top 7 eCommerce Partners NYC for Shopify Brands in 2026

Machine Learning for Ecommerce: Boost Your Shopify Store

Beauty Market Research: Your 2026 Growth Guide

Shopify International Expansion: A 2026 Roadmap
What Does CRO Stand for in Business: Understanding CRO
Shopify Visual Merchandising: A Playbook for Higher Sales

Shopify Landing Page Design: Master Conversion in 2026
10 Best AI SEO Optimization Tools for Shopify in 2026

Agentic AI for Ecommerce: Boost Your Sales in 2026
Mastering Email Marketing Data for eCommerce Growth
Conversion Rate Optimisation Australia: Boost Your Sales
Conversion Rate Optimization AI: Your Shopify Store Guide

10 Product Bundling Strategies for Shopify in 2026
How to Increase Customer Lifetime Value: A Shopify Playbook
AI Customer Service Automation: Shopify Guide 2026
Clean Website Design: A Shopify Conversion Playbook

Omnichannel Retail Strategy: A Shopify Playbook
Product Data Enrichment: A Guide for Shopify Brands
Instagram Shopping Features a Guide for Shopify Stores
What Is Revenue Optimization: A Holistic RevOps Guide
Benefits of Conversion Rate Optimization: Boost Your
WordPress to Shopify Migration: Your 2026 Seamless Switch
Boost Sales: Ecommerce Payment Processing Guide 2026
Unified Commerce Platform: Benefits, KPIs & Shopify Guide
How to Reduce Bounce Rate eCommerce: Your 2026 Guide
Shopify API Integration: A Practical End-to-End Guide
How to Implement Data Governance: A 2026 Guide
Shopify Store Development Cost: A 2026 Breakdown
What Is Server Side Tracking: The Shopify Guide 2026
Marketing Automation Workflows: A Shopify Guide for 2026
Shopify: How to Reduce Technical Debt

Shopify UX Design Change: A Playbook for Growth

User Generated Content Strategy: Shopify Playbook

Shopify Pause and Build Plan Cost: A Complete 2026 Guide
Compare at Price on Shopify: A Complete Guide for 2026
Where Can I Sell My Prints? 10 Best Platforms for 2026
Shopify Order Management System: The Ultimate Guide 2026
What Is Marketing Attribution? an eCommerce Guide for 2026
10 Best Black Friday Sales Sheets for 2026

Discover the Top Social Media Marketing Agencies For
Consumer Confidence Definition for eCommerce in 2026
What Is Social Commerce? Your 2026 Guide to Boosting Sales
A Social Ad Campaign Playbook for eCommerce Growth
7 Best FAQ Page Examples for SaaS & eCommerce

Market Research in Fashion Industry: A Guide for Shopify
Shopify Migration Services: Expert Guide for 2026
Mastering FB Retargeting Ads for Shopify in 2026
What Is Omnichannel Ecommerce

Master Your Shopify Plus Migration: The 2026 Guide
Shopify Integration Services: A Merchant's 2026 Guide
Shopify Collection Description: A Guide to SEO & Sales
Shopify Plus Contact: Reach Sales & Support Effectively

Top Luxury Shopify Stores: Design & UX Strategies
How to Improve Customer Experience: A Shopify Roadmap
Creative Facebook Ads: 10 Examples for Shopify Brands

Remarketing with Facebook Ads: A Shopify Guide for 2026

SEO Linking Strategies for Shopify Stores
Top 7 Statistics YouTube Channels for eCommerce in 2026

Hiring Shopify Plus Designers: A Founder's Guide

Shopify Product Variation: Master Your Variants for 2026

Leverage Ai Solutions Brands: Your 2026 Shopify Growth Guide
Filters in Shopify: A Guide for Growing Brands

Shopify Plus Developer: A Guide for Growing Brands

When Does Black Friday Online Start? A 2026 Guide
Black Friday Email Marketing: Shopify & Klaviyo Guide

Polaris Design System: The Complete Shopify Guide

How to Hire a Consultant Email Marketing Expert
What Is Q4? A Shopify Merchant's Guide to Peak Season

Marketing Organization Structure for eCommerce Growth

Top Account-Based Marketing Agency Guide for 2026

7 Remarketing Ad Examples for Your 2026 Campaigns

AI Retail Solutions: Boost Your Shopify Store

Migrate to Shopify: The Definitive 2026 Guide
Shopify Authentication App: A Guide for Secure Stores
Why Strategic Marketing Is Important for Growth in 2026
How to Create a Size Chart in Shopify: 2026 Guide

Shopify Themes for Jewelry: The Definitive 2026 Guide

Minimal Shopify Templates: Faster, Higher-Converting Stores
Maximize Profit: Shopify CC Fees 2026 Guide

Best Shopify Apps for Beginners in 2026

How to Improve Online Shopping Experience in 2026

Shopify Design and Development Services: A 2026 Guide

Small Business Social Media Marketing Agency: A Hiring Guide
Bulk Edit Shopify: A Guide to Save Hours on Store Updates

2026 Trends in Food and Beverage Industry
Post Purchase Survey Guide for Shopify Stores

How to Build an Ecommerce Brand in 2026
Conversion Rate Optimization for Ecommerce: Maximize Profit
How to Use Customer Data to Increase Sales: A Guide
Shopify for Enterprise: The 2026 Deep Dive Guide

Email Marketing Agencies: The Guide for Shopify Brands


newsletter in your inbox