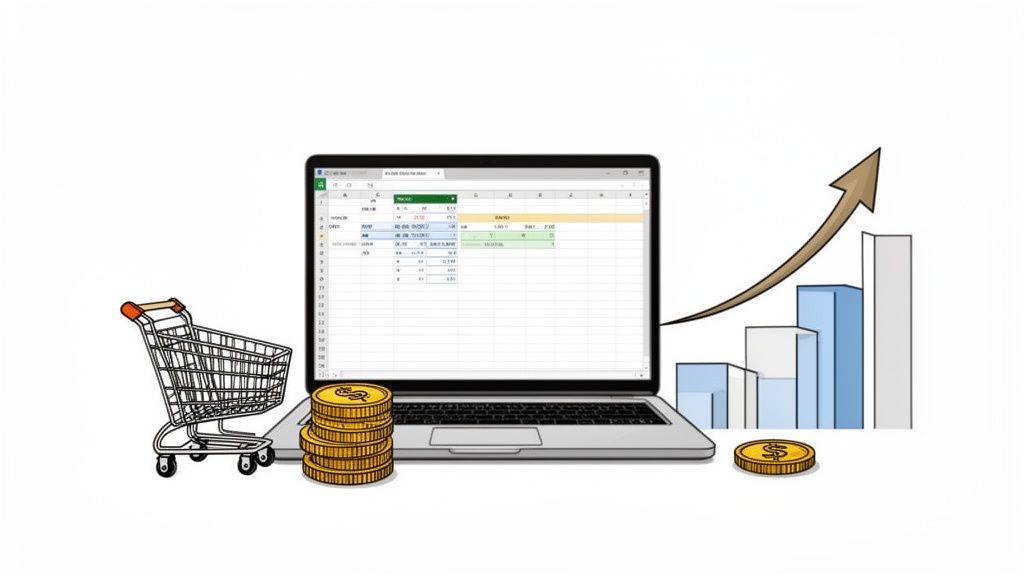
An ecommerce profit calculator is one of those tools that separates the hobbyists from the serious players. It's the essential gut check that cuts through the vanity metric of revenue to show you what you're actually putting in the bank. So many brands get caught up watching their sales climb, only to wonder why their cash flow is flat.
A good profit calculator accounts for all the sneaky costs—shipping, marketplace fees, ad spend, returns—that quietly drain your margins on every single order. It ensures that your growth on paper translates to a healthier bank account in reality.
Why an Ecommerce Profit Calculator Is Non-Negotiable
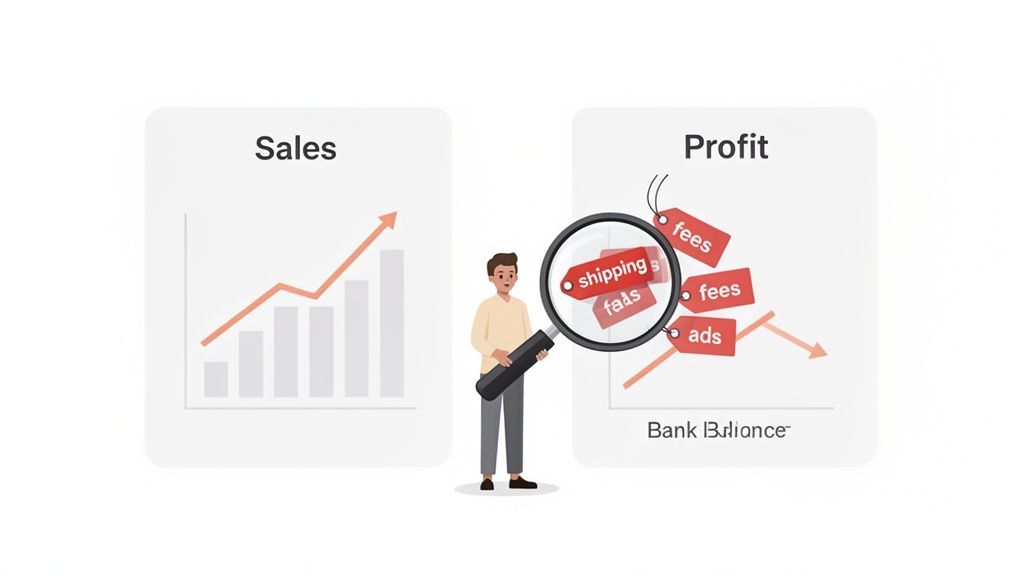
It’s a painfully common trap. Your revenue is climbing, maybe even hitting record highs, but your actual cash flow feels stagnant. Or worse, it’s shrinking.
This disconnect happens when you're laser-focused on top-line sales without a clear view of the dozens of small costs chipping away at every transaction. This is precisely where an ecommerce profit calculator becomes your most valuable business tool. Forget vanity metrics; it's time to get real about what you're earning.
This guide will give you a clear, actionable framework for calculating your profit with the precision you need. The goal is to get you making data-driven decisions that genuinely boost your bottom line—not just your sales figures.
The Pain of Hidden Costs
I've seen it happen to countless direct-to-consumer brands. They have impressive sales numbers and look like they're crushing it from the outside. But a closer look at the books reveals they're actually losing money on every order. How? They simply failed to account for a cocktail of small but significant expenses.
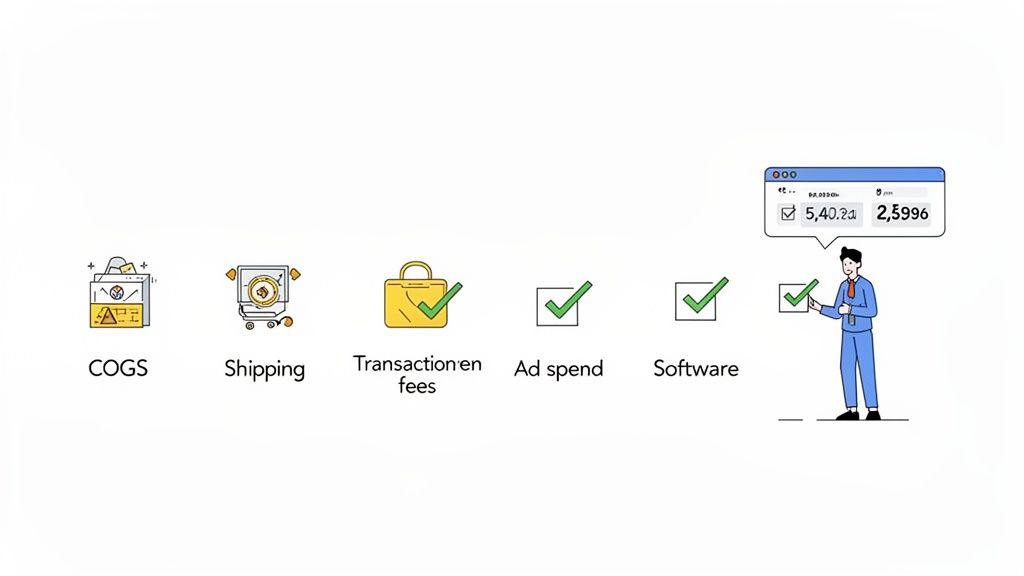
These are the usual suspects that often fly under the radar:
- Payment Processing Fees: That standard 2.9% + $0.30 per transaction feels minor, but it stings when you multiply it by thousands of orders.
- Shipping Supplies: The cost of your branded boxes, poly mailers, and packing tape isn't just an office expense; it's a direct cost tied to every order you ship.
- Ad Spend Nuances: Knowing your total ad budget is one thing. Knowing the exact cost to acquire a customer for a specific product is a whole different ballgame.
- Software Subscriptions: All those monthly fees for the apps that keep your store running? They're operational costs that directly impact your net profit.
A profit calculator isn't just about finding a final number. It's about building a financial model that shines a spotlight on the weak points in your operations. It turns that vague financial anxiety into a clear, actionable plan.
The ecommerce world is only getting more crowded and competitive. The global market is absolutely exploding; by 2025, more than 2.77 billion shoppers will be driving $7.4 trillion in online retail sales. This massive scale creates huge opportunities for efficiency—higher volumes can slash per-unit costs by 15-25%. You can learn more about these critical online retail trends to understand the landscape you're competing in.
Without a precise calculator, you're flying blind. You can't capitalize on those economies of scale or protect your margins from the quiet erosion of hidden costs.
Before you can start crunching the numbers, you need to gather the right data. Think of it as gathering your ingredients before you start cooking. The table below outlines the key metrics you'll need to pull together for an accurate calculation.
Key Metrics for Your Ecommerce Profit Calculator
A quick reference to the essential data you'll need to gather before accurately calculating your store's profitability.
Having these numbers ready will make the process of calculating your profit much smoother and far more accurate. Don't estimate—dig into your reports and find the real figures.
Tracking Down Every Cost to Your Business
An ecommerce profit calculator is only as good as the numbers you feed it. The fastest way to get a misleading picture of your store’s financial health is to rely on guesswork and estimations. Real clarity comes from digging in and tracking down every single expense, no matter how small it seems.
This process can feel like a chore, but it’s the absolute bedrock of taking control of your profitability. Let's start with the most obvious one: the cost of your products.
Calculating Your Cost of Goods Sold
Your Cost of Goods Sold (COGS) represents the direct costs of getting your products ready to sell. This isn't just what you paid your supplier; it's the fully landed cost that includes everything it took to get that item onto your warehouse shelf.
For instance, if you run a DTC apparel brand, the COGS for a custom t-shirt is more than just the blank shirt. You have to account for:
- Raw Materials: The cost of the blank t-shirt from the manufacturer.
- Manufacturing Labor: Any fees for screen printing, embroidery, or custom tags.
- Inbound Shipping: The freight charges to ship the bulk order to your fulfillment center.
- Duties and Tariffs: Import taxes you paid to get the goods into the country.
To get your true COGS per unit, just add up all these costs and divide by the number of units in the shipment. If you spent a total of $5,000 to land 1,000 shirts, your COGS per shirt is $5.00. This number is the foundation of every other profit calculation you'll make.
Uncovering Hidden Operational Costs
Beyond COGS, a whole host of operational costs quietly chip away at your margins. These are the expenses that many store owners forget, which leads to a dangerously inflated sense of how much money they're actually making.
These costs are often scattered across different dashboards—your Shopify account, your Stripe statements, and your ad manager reports. You have to hunt them down.
Let's stick with our apparel brand example. After a customer buys a $30 t-shirt (with a $5.00 COGS), a cascade of other fees kicks in before you see a cent of profit.
It's a classic mistake to focus only on big-ticket items like inventory and ad spend. In reality, transaction fees, software subscriptions, and even your custom packaging can easily eat up an additional 5-10% of your revenue on every single sale.
Variable Costs Tied to Every Sale
These expenses scale directly with your order volume. The more you sell, the more you pay. It's a simple relationship, but the numbers add up fast.
- Shipping & Fulfillment: This is so much more than just the postage fee. You've got your branded boxes ($0.75), poly mailers ($0.20), packing tape, and any marketing inserts. If you use a 3PL, you also have pick-and-pack fees for every single order. Check out our guide for some practical advice on how to reduce shipping costs to protect those margins.
- Payment Processing Fees: Whether you use Shopify Payments, Stripe, or PayPal, you're paying a fee on every transaction. A typical rate is 2.9% + $0.30. For our $30 shirt, that’s $1.17 that goes straight to the payment processor.
- Marketplace Commissions: Selling on platforms like Amazon or Etsy? They take a significant cut, often around 15%. This is a massive variable cost that has to be factored into your pricing for those specific channels.
Fixed Costs and Marketing Spend
Finally, you have your fixed operational costs and your ad budget. While ad spend can fluctuate, it's helpful to manage it as a distinct category separate from your other order-related variable costs.
- Ad Spend: This is your Customer Acquisition Cost (CAC). Just pull the reports from your Meta Ads and Google Ads managers. If you spent $1,000 on ads last month and got 100 orders, your average CAC is $10 per order. A good profit calculator will let you analyze this on a per-product or campaign basis.
- Software Subscriptions: It's time to tally up the monthly costs for all your tools. This includes your Shopify apps, your email platform (like Klaviyo), design tools, and anything else that keeps your business humming. If these total $300/month, that needs to be factored into your overall net profit.
Gathering all these numbers is definitely the hard part, but it's non-negotiable. Once you have this complete financial picture, you can finally plug it into a calculator and see where your money is truly going. This is how you start making smart, data-driven decisions to grow a healthier, more resilient business.
The Essential Formulas for Ecommerce Profitability
Alright, you’ve put in the work and gathered all your cost data. Now for the fun part: turning those raw numbers into actual business intelligence. This is the moment you stop being a data collector and start becoming a strategist.
Don't let the word "formulas" scare you off. These aren't some dusty equations from an accounting textbook; they're the language of profitability. Think of them as a diagnostic toolkit. Each one gives you a different lens to look at your store's performance, from the 30,000-foot view all the way down to a single sale. Mastering them turns your financial reports from a math test into a strategic roadmap.
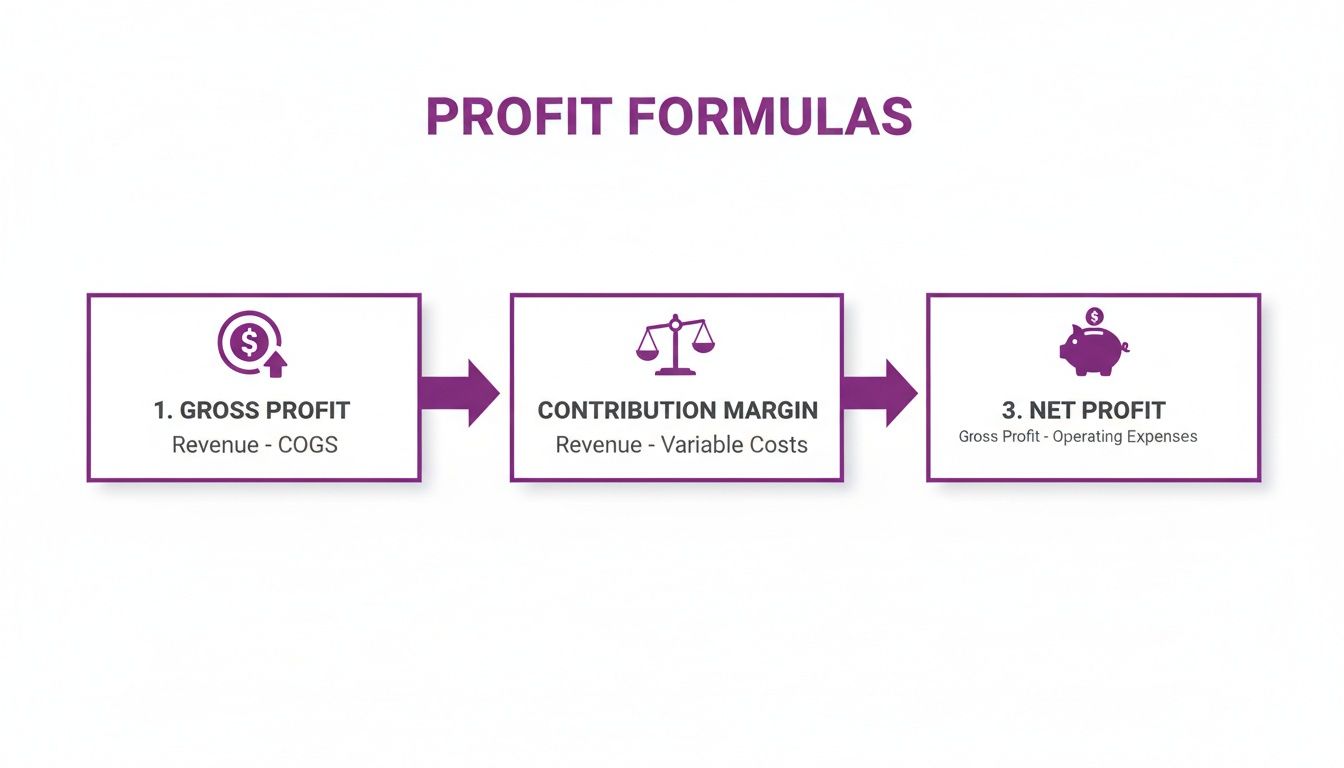
The First Look: Gross Profit
Gross Profit is your starting point. It’s the simplest, most immediate measure of how profitable a product is. It tells you exactly how much cash is left from a sale after you’ve paid for the product itself.
The formula couldn't be simpler:
Gross Profit = Net Revenue - Cost of Goods Sold (COGS)
Net Revenue is your total sales revenue after you subtract any discounts or returns. It's so important to use this number, not just your top-line sales, because discounts and returns are real cash that never actually hit your bank account.
Let's go back to our DTC apparel brand. A customer buys a performance t-shirt for $40.
- Retail Price: $40.00
- COGS (Landed Cost): $8.00
The Gross Profit for this one sale is $32.00. But hold on—this $32 isn't what you get to take home. It's the pot of money you have left to cover every other business expense, from your marketing campaigns to your Shopify subscription.
If you want to go deeper on this, we've got a whole guide on how to calculate profit margins that breaks it down even further.
The Real Story: Net Profit
Net Profit is the true bottom line. This is the number that tells you what your business actually earned after every single expense is paid. Honestly, it's the ultimate indicator of your company's financial health and whether you've built something sustainable.
The formula simply builds on Gross Profit by subtracting everything else:
Net Profit = Gross Profit - Operating Expenses
Operating Expenses (or OpEx) is a catch-all for all the variable and fixed costs of running your business that aren't part of COGS. It’s a pretty broad category.
- Variable Costs: Things like shipping fees, payment processing, and packaging.
- Marketing Costs: Your ad spend on Meta, Google, TikTok, etc.
- Fixed Costs: Predictable costs like software subscriptions, salaries, and warehouse rent.
Let's calculate the Net Profit for our apparel brand over a single month.
- Gross Profit (from 1,000 shirt sales): $32,000
- Total Ad Spend: $7,000
- Shipping & Fulfillment: $5,000
- Payment Processing Fees: $1,500
- Software & Salaries (Fixed Costs): $4,500
The math looks like this: $32,000 - ($7,000 + $5,000 + $1,500 + $4,500) = $14,000.
So, the store’s Net Profit for the month is $14,000. This is the number that truly matters for long-term planning, reinvesting in growth, and paying yourself.
The Strategic Metric: Contribution Margin
While Net Profit is the final scorecard, I'd argue Contribution Margin is the most powerful metric for making day-to-day strategic decisions. It tells you exactly how much profit from a single sale contributes to covering your fixed overhead costs.
The formula is designed to isolate your variable costs:
Contribution Margin = Net Revenue - All Variable Costs
Remember, variable costs are any expenses that only happen when you make a sale. This includes your COGS, shipping and handling, payment processing fees, and sometimes even a portion of your ad spend.
Contribution Margin is your secret weapon for decision-making. It helps you answer critical questions like, "Is this ad campaign actually profitable?" or "Can we afford to offer free shipping on this product?"
Let's run the numbers for our single $40 t-shirt sale.
- Net Revenue: $40.00
- COGS: $8.00
- Shipping & Fulfillment: $5.00
- Payment Processing Fee (approx.): $1.46
The Contribution Margin is: $40.00 - ($8.00 + $5.00 + $1.46) = $25.54.
This means every time you sell one of these t-shirts, you generate $25.54 to put towards paying your fixed costs like rent and salaries. Once those are covered, every subsequent $25.54 is pure profit. This kind of clarity is absolutely essential for setting smart marketing budgets and truly understanding where your break-even point is.
Build Your Own Ecommerce Profit Calculator
Alright, understanding the formulas is one thing. But actually putting them to work is where you start seeing real results. Theory is just the blueprint; what we need is the tool that builds the house. Let's move from the concepts and get our hands on a tangible ecommerce profit calculator you can start using right away.
We went ahead and built a comprehensive Google Sheets template just for ecommerce businesses like yours. This isn't some generic spreadsheet. Think of it as a dynamic financial dashboard designed to give you instant clarity on your numbers. You don't need an accounting degree for this—it's built for founders and operators who need actionable insights, fast.
Your Go-To Visual Guide
The spreadsheet comes pre-loaded with all the essential formulas, so your only job is to plug in the numbers you've already gathered. The tool takes care of the heavy lifting, automatically calculating everything from your profit per SKU all the way to your store-level net profit and break-even point.
Let's walk through how to use it. The whole point is to make financial tracking feel less like a chore and more like a superpower. You’ll see your true profitability in minutes, not weeks.
This flow chart breaks down the core calculations your new spreadsheet will handle for you, moving from the top-line sale down to your final net profit.
As you can see, each formula builds on the last one, giving you a complete financial picture of every single sale.
Where to Plug In Your Numbers
The template is organized into simple sections to make data entry a breeze. You'll find specific cells for every cost we've talked about, from your landed COGS and ad spend to shipping fees and software subscriptions.
The most common mistake I see store owners make is using guesstimates. Pull the real numbers from your Shopify dashboard, your ad manager reports, and your payment processor statements. Your calculator is only as good as the data you feed it.
Simply fill in the yellow cells, and the spreadsheet does the rest. Here’s a quick rundown of the key inputs:
- Product Information: Start with the basics—your SKU name and retail price.
- Cost of Goods Sold (COGS): Enter your fully landed cost per unit. This is the bedrock of your entire profit calculation.
- Payment Processing Fees (usually a percentage)
- Marketplace Commissions (like Amazon or Etsy fees)
- Packaging & Insert Costs
Making Sense of the Results
Once your data is in, the magic happens. The template instantly fills out the output fields, giving you a clean dashboard of your store's financial health. No need to mess around with VLOOKUP or SUMIF formulas.
You’ll immediately get three critical metrics calculated for each product:
- Gross Profit & Margin: This is your profit after just the cost of the product is deducted.
- Contribution Margin: This tells you how much each sale contributes to covering your fixed costs. It's probably the most strategic metric you have for making marketing decisions.
- Net Profit Per Unit: Your true profit on a single item after all variable costs, including marketing, are factored in.
Having this tool gives you complete control over your financial tracking. It's not just about finding a single number; it's about building a system that lets you model different scenarios. What happens if your ad costs jump by 15%? What if you find a supplier that's 10% cheaper?
This ecommerce profit calculator lets you answer those questions with real data, turning you from a reactive seller into a proactive business strategist. You can finally make decisions with confidence, knowing they’re backed by a rock-solid understanding of your numbers.
Advanced Strategies to Optimize Your Profit
Once you've got a working ecommerce profit calculator, you've graduated from simply tracking your numbers to actively influencing them. The real magic of this tool is its power to inform the strategic decisions that actually drive sustainable growth.
It's time to look beyond one-off transactions and start focusing on the long-term health of your customer relationships. Moving past basic profit tracking means bringing more sophisticated metrics into your analysis. These KPIs give you a much deeper read on your business's true performance and help you answer the most critical question for any scaling brand: are we acquiring customers profitably?
Introducing LTV and CAC
Two of the most important metrics for any growing ecommerce brand are Customer Lifetime Value (LTV) and Customer Acquisition Cost (CAC). Honestly, mastering these two numbers is the difference between blindly throwing money at marketing and investing with surgical precision.
- Customer Acquisition Cost (CAC): This is your total sales and marketing cost to get a single new customer in the door. The formula is simple: divide your total marketing spend over a period by the number of new customers you brought in during that same period.
- Customer Lifetime Value (LTV): This metric forecasts the total net profit you can expect from a single customer over their entire relationship with your brand. It takes a bit more data, but a solid starting point is: (Average Order Value) x (Average Purchase Frequency) x (Average Customer Lifespan).
You know you have a healthy business model when your LTV is significantly higher than your CAC. A good rule of thumb is a 3:1 ratio—meaning a customer's lifetime value is at least three times what you paid to acquire them. Your profit calculator is the foundation for getting the data you need to figure this out.
The LTV to CAC Ratio in Action
Let's say your apparel brand has a CAC of $30. After digging into your sales data, you find that your average customer makes three purchases over two years. Their average order value is $50, and you have a contribution margin of 40%.
Here’s how the LTV calculation would shake out: ($50 AOV x 3 Purchases) x 40% Margin = $60 LTV.
With a $60 LTV and a $30 CAC, your LTV:CAC ratio is 2:1. That’s not bad—you're profitable. But it also signals that your margins for growth, unexpected costs, or a slow month are pretty thin. The goal now is to either push your CAC down or, even better, find ways to increase your LTV. This is where real strategy begins.
The LTV:CAC ratio is the ultimate health check for a scaling brand. It tells you not just if you're making money today, but if your growth engine is built to last for years to come.
Optimizing Profit Across Different Channels
Profitability is never a flat line across your entire business, especially if you’re selling on multiple platforms. The profit you bank from a sale on your Shopify store will look worlds different from an Amazon sale or a wholesale order. This is all down to varying fee structures, marketing costs, and operational logistics.
Think about it:
- Shopify/DTC: This is where you have the highest margin potential, but you're also on the hook for the full cost of marketing (your CAC).
- Amazon: You get access to a massive built-in audience, but Amazon's fees (15% or more) will take a serious bite out of your profit on every single unit.
- Wholesale: You move a lot of product in bulk at a lower price, which means lower per-unit margins. The upside? A much lower (or even zero) direct CAC.
Use your profit calculator to model out scenarios for each channel. This kind of analysis is invaluable for deciding how to allocate your inventory and where to focus your marketing budget. For example, once you understand your channel-specific numbers, you can implement advanced tactics like a profit-first Amazon anchor pricing strategy to protect your margins and boost conversions there.
This level of granular, channel-by-channel analysis is what turns a good business into a great one.
Common Questions About Ecommerce Profit
Even with the best formulas laid out, you're bound to have questions. Let's be honest, calculating ecommerce profit has a lot of moving parts, and every business has its own quirks.
Here, I'll walk through some of the most common questions and sticking points I see store owners run into. Think of this as the FAQ section for getting your numbers straight and building confidence in your calculations.
How Often Should I Be Calculating Profit?
This is a great question, and the real answer is: it depends on what you're trying to do.
For a big-picture, 30,000-foot view of your store's health, running the numbers on your net profit once a month is a solid baseline. This rhythm lines up nicely with most accounting practices and lets you spot broader financial trends before they become major issues.
But when things are moving fast, you need to zoom in. During crunch time—think Black Friday Cyber Monday or a big new ad campaign launch—you should be checking profitability weekly, if not daily. This is the only way to know if a campaign is bleeding cash so you can pull the plug before it does real damage.
As for SKU-level profitability, you need to revisit it any time a major cost changes. That could be triggered by:
- Your supplier hitting you with a price increase.
- Your shipping carrier announcing new, higher rates.
- A marketplace like Amazon changing its commission structure.
This is where a dynamic tool really shines, giving you that near real-time visibility without you having to manually crunch numbers every single day.
What's the Biggest Mistake People Make?
Hands down, the single most common—and most damaging—mistake is ignoring the "little" costs. So many entrepreneurs get tunnel vision on the big-ticket items like inventory and ad spend, and they completely forget about the silent killers that slowly eat away at their margins.
These costs might seem small on their own, but they add up fast and can completely flip your financial picture, turning what looked like a winner into a product that's losing you money on every single sale.
The most dangerous assumption in ecommerce is that small fees don't matter. A payment processing fee of 2.9% + 30¢, packaging materials, and software subscriptions can easily consume 5-10% of your revenue before you even account for marketing.
A really thorough profit calculation forces you to look at every single cent, protecting you from this incredibly common trap.
Can't I Just Use My Shopify Analytics Report?
Shopify Analytics is a fantastic tool, but on its own, it doesn't tell the full story of your net profit. The native reports are great for figuring out your gross profit because they do a clean job of subtracting your Cost of Goods Sold (COGS) from your sales revenue.
The problem is, your Shopify dashboard has no idea about all your other operating costs. It doesn't know what you're spending on Google Ads, your Klaviyo subscription, or the fees from your third-party logistics (3PL) partner.
The best way to think about it is that Shopify Analytics gives you a critical piece of the puzzle. You still need a dedicated calculator or a well-built spreadsheet to pull in all those other business costs to get to your true, bottom-line net profit.
How Do I Handle Discounts and Returns in My Math?
Discounts and returns aren't just headaches; they are direct hits to your revenue and you have to account for them properly.
To get your actual Net Revenue, you absolutely must subtract the total value of all discounts and customer refunds from your Gross Revenue. If you skip this, your starting number is way too high, and all your other calculations will be dangerously optimistic.
And returns come with a whole host of extra costs beyond just the refund. You've got the cost of the return shipping label, the labor it takes to inspect and restock the item, and the potential for lost inventory if the product comes back damaged. A good profit calculator will have separate lines for "Discounts" and "Return-Related Costs" to make sure you never miss these crucial deductions. For more in-depth guides and answers to common questions about boosting your online store's earnings, check out these additional resources on ecommerce profitability.
At ECORN, we turn these complex financial insights into actionable growth strategies for Shopify stores. If you're ready to go from just calculating profit to actively optimizing it, our team is here to help. Explore our Shopify expert services and see how we can build a more profitable future for your brand.


Shopify: How to Reduce Technical Debt

Shopify UX Design Change: A Playbook for Growth

User Generated Content Strategy: Shopify Playbook

Shopify Pause and Build Plan Cost: A Complete 2026 Guide

Compare at Price on Shopify: A Complete Guide for 2026

Where Can I Sell My Prints? 10 Best Platforms for 2026

Shopify Order Management System: The Ultimate Guide 2026
What Is Marketing Attribution? an eCommerce Guide for 2026

10 Best Black Friday Sales Sheets for 2026

Discover the Top Social Media Marketing Agencies For

Consumer Confidence Definition for eCommerce in 2026

What Is Social Commerce? Your 2026 Guide to Boosting Sales

A Social Ad Campaign Playbook for eCommerce Growth

7 Best FAQ Page Examples for SaaS & eCommerce

Market Research in Fashion Industry: A Guide for Shopify

Shopify Migration Services: Expert Guide for 2026

Mastering FB Retargeting Ads for Shopify in 2026
What Is Omnichannel Ecommerce

Master Your Shopify Plus Migration: The 2026 Guide
Shopify Integration Services: A Merchant's 2026 Guide
Shopify Collection Description: A Guide to SEO & Sales

Shopify Plus Contact: Reach Sales & Support Effectively

Top Luxury Shopify Stores: Design & UX Strategies

How to Improve Customer Experience: A Shopify Roadmap

Creative Facebook Ads: 10 Examples for Shopify Brands

Remarketing with Facebook Ads: A Shopify Guide for 2026

SEO Linking Strategies for Shopify Stores
Top 7 Statistics YouTube Channels for eCommerce in 2026

Hiring Shopify Plus Designers: A Founder's Guide

Shopify Product Variation: Master Your Variants for 2026

Leverage Ai Solutions Brands: Your 2026 Shopify Growth Guide

Filters in Shopify: A Guide for Growing Brands

Shopify Plus Developer: A Guide for Growing Brands

When Does Black Friday Online Start? A 2026 Guide
Black Friday Email Marketing: Shopify & Klaviyo Guide

Polaris Design System: The Complete Shopify Guide

How to Hire a Consultant Email Marketing Expert

What Is Q4? A Shopify Merchant's Guide to Peak Season

Marketing Organization Structure for eCommerce Growth

Top Account-Based Marketing Agency Guide for 2026

7 Remarketing Ad Examples for Your 2026 Campaigns

AI Retail Solutions: Boost Your Shopify Store

Migrate to Shopify: The Definitive 2026 Guide

Shopify Authentication App: A Guide for Secure Stores

Why Strategic Marketing Is Important for Growth in 2026

How to Create a Size Chart in Shopify: 2026 Guide

Shopify Themes for Jewelry: The Definitive 2026 Guide

Minimal Shopify Templates: Faster, Higher-Converting Stores

Maximize Profit: Shopify CC Fees 2026 Guide

Best Shopify Apps for Beginners in 2026

How to Improve Online Shopping Experience in 2026

Shopify Design and Development Services: A 2026 Guide

Small Business Social Media Marketing Agency: A Hiring Guide

Bulk Edit Shopify: A Guide to Save Hours on Store Updates

2026 Trends in Food and Beverage Industry

Post Purchase Survey Guide for Shopify Stores

How to Build an Ecommerce Brand in 2026
Conversion Rate Optimization for Ecommerce: Maximize Profit
How to Use Customer Data to Increase Sales: A Guide

Shopify for Enterprise: The 2026 Deep Dive Guide

Email Marketing Agencies: The Guide for Shopify Brands

Boost Sales With The Right Shipping Shopify App

Your Guide to the Shopify Site Map

7 Headless Commerce Examples for 2026

Mastering Trends in Cosmetic Industry for 2026

Transfer Shopify to BigCommerce The Complete 2026 Playbook

What Is Shopify Collective? Your 2026 Guide to Success

Unlock Shopify Growth with Site Link SEO

Integrating Shopify and WordPress A Complete Guide for 2026

Naming a Clothing Store: A Shopify Founder's Playbook

Guide to buying shopify store in 2026

Buying shopify store: Buying a Shopify Store: Invest Wisely

Food & Beverage Marketing: A Complete Guide for 2026

Facebook Ads Agency: A Shopify Brand's Hiring Guide

Shopify Apparel Stores: A 2026 Launch & Scale Guide

How to Deactivate Shopify Store: The 2026 Guide

Shopify and Square: The 2026 Ultimate Comparison

Your Guide to Beauty Products Ecommerce

A Guide to Marketing for Beauty Brands in 2026

Your Guide to Facebook Black Friday Ads

Facebook Ad Ecommerce for Shopify Growth

Iconography Web Design The Definitive Guide for Shopify Stores

A Modern Backlinks SEO Strategy for Shopify Stores

How to Launch an Online Store: A Step-by-Step Success Guide

Optimize Shopify Store: Master Performance in 2026

Successful Migration for Shopify: Protect SEO & Grow

Maximize Traffic & Sales: Get Your Free Website Audit Report

Master the Best Ads Facebook Formats for eCommerce Success

How to Find the Best Ecommerce Agency Near Me in 2026

10 Crucial White Hat Techniques SEO for Shopify in 2026

How to Reduce Returns and Boost Profits in Your eCommerce Store

What Is Ecommerce Personalization A Guide to Unlocking Growth

Payment gateways in shopify: The Ultimate Guide for Merchants 2026

Fulfillment services for shopify: Scale Your Ecommerce Brand

Shopify Landing Page Examples: 7 Winning Templates to Boost Conversions

How to Create Urgency in Sales on Shopify

The Best Review Apps for Shopify to Drive Growth in 2026

The Best Ecommerce Platform for Startups in 2026

Choosing Ecommerce Website Design Packages A Complete Guide

Shopify Plus Partners: Guide to shopify plus partners for 2026 growth


newsletter in your inbox