To figure out your cost per acquisition, you start with a core formula: Total Marketing Costs ÷ Total New Customers. It's a simple equation on the surface, but it’s your first real step toward understanding how much you're actually spending to land each new customer. Think of it as the most basic health check for your marketing efficiency.
Your Foundation for Profitable Marketing
Before you can really get a handle on your marketing budget, you have to know your numbers inside and out. While the basic CPA formula is straightforward, the real magic happens when you understand what "Total Costs" actually means for a modern marketing team. It’s about so much more than just ad spend.
A truly accurate CPA calculation needs to track every single dollar that went into acquiring that customer. This means you've got to dig a lot deeper than the surface-level numbers you see on your Google Ads dashboard.
What to Include in Total Costs
To get a realistic picture of your spending, you need to pull together expenses from all over the place. Think about every resource that keeps your marketing engine running.
- Direct Ad Spend: This one's the most obvious. It's the cash you're paying directly to platforms like Google, Meta, LinkedIn, or TikTok to get your campaigns in front of people.
- Software and Tools: Don't forget the monthly or annual fees for your entire marketing stack. This includes your email platform, SEO tools, analytics software, and any automation or CRM systems you rely on.
- Agency or Freelancer Fees: If you're outsourcing any part of your marketing—whether it's content creation, ad management, or SEO—those payments are a direct acquisition cost.
- Creative and Content Costs: You have to factor in the expenses for actually producing your marketing assets. This could be anything from the cost of a video shoot and graphic design work to paying writers for blog content.
Understanding your cost per acquisition is a critical component of assessing your overall video marketing ROI and ensuring your marketing spend is truly effective.
To make this crystal clear, here’s a breakdown of the key components that go into your CPA calculation.
Key Components of Your CPA Calculation
This table breaks down the two main variables in the Cost Per Acquisition formula, clarifying what specific costs and conversion types to include for an accurate measurement.
By meticulously tracking both sides of this equation, you get a CPA figure you can actually trust to make smart budget decisions.
Defining an "Acquisition"
Just as important as adding up all your costs is being crystal clear on what an "acquisition" actually means for your business. For an ecommerce store, it's almost always a customer's first purchase. For a SaaS company, it might be a new paid subscription. The key is to be consistent with your definition so your tracking stays reliable over time.
This visual from Spider AF really drives home the simplicity and power of the CPA formula.
As the image shows, the calculation boils down to two core parts: how much you spent and what you got for it. This isn't just a vanity metric; it’s a vital sign for your campaign's health. It gives you a reliable benchmark to measure performance and guides the kind of data-driven decisions that directly boost your bottom line.
Sourcing the Data You Can Actually Trust
An accurate CPA calculation is built on a foundation of trustworthy data. The formula itself is simple, but it’s only as good as the numbers you plug into it. Knowing where to find reliable cost and conversion data is absolutely essential.
Think of this as your practical playbook for gathering the right numbers without getting lost in a sea of technical jargon.
We'll focus on the two main places you’ll need to look: your advertising platforms for cost data and your analytics platform for conversion data.
Pulling Cost Data from Ad Platforms
Your total marketing cost is more than just ad spend, but let's be honest—ad spend is the biggest and most direct chunk of it. Getting this number right is your first step.
Thankfully, platforms like Google Ads and Meta Ads (for Facebook and Instagram) make this pretty straightforward.
Just log into your ad account and you can find the total spend for any given period. You’ll see it labeled as “Cost” or “Amount Spent” right in your main dashboard or reporting section. The key here is to make sure the date range you select perfectly matches the period you'll use for tracking conversions.
Don’t just glance at the campaign-level costs. Dig a little deeper to account for any account-level spending or platform fees that might not be obvious in your primary view. This ensures you’re not missing any hidden costs that could throw off your calculation.
Tracking Conversions in Google Analytics 4
While your ad platforms will report their own conversion numbers, I always treat Google Analytics 4 (GA4) as the central source of truth. It gives you a much more holistic view of what happens after a user clicks an ad.
For any ecommerce store, the most important conversion event is almost always a purchase. In GA4, this is a standard event you can—and should—mark as a key conversion. By doing this, you're officially telling Google that this specific action is what defines a successful acquisition for your business.
A critical next step is setting up your analytics to separate new customers from returning ones. After all, CPA is all about acquiring new customers. You need to filter your data to isolate those first-time purchases. GA4 lets you create segments specifically for new users, which gives you a clean, accurate count of true acquisitions.
Choosing the Right Attribution Model
Attribution is how you give credit for a sale to the different marketing touchpoints in a customer's journey. Your choice of attribution model will directly impact your CPA calculation, so it’s important to understand the difference.
- Last-Click Attribution: This model gives 100% of the credit to the very last touchpoint before a conversion. It's simple, but it’s also often misleading because it completely ignores all the previous interactions a customer had with your brand.
- Data-Driven Attribution: This is the default model in GA4, and for good reason. It uses machine learning to intelligently distribute credit across various touchpoints based on how much they actually contributed to the final sale. It’s a much smarter approach.
For instance, a customer might see a Facebook ad, later search for your brand on Google, click a shopping ad, and finally convert. Last-click would give all the credit to the Google Shopping ad. But a data-driven model would rightly assign partial credit to the Facebook ad and the brand search, giving you a far more accurate picture of how your channels work together.
This leads to a more realistic and actionable how to calculate cost per acquisition process, which is exactly what you need to make better marketing decisions.
Alright, theory is one thing, but let's get our hands dirty. The only way to really wrap your head around cost per acquisition is to see how it works with real numbers from real businesses.
Let's walk through three different scenarios—an ecommerce store, a SaaS company, and a local service business. Breaking down their unique costs and what they count as an "acquisition" will make this whole calculation click.
This simple visual breaks down the core process of moving from spending to calculating.
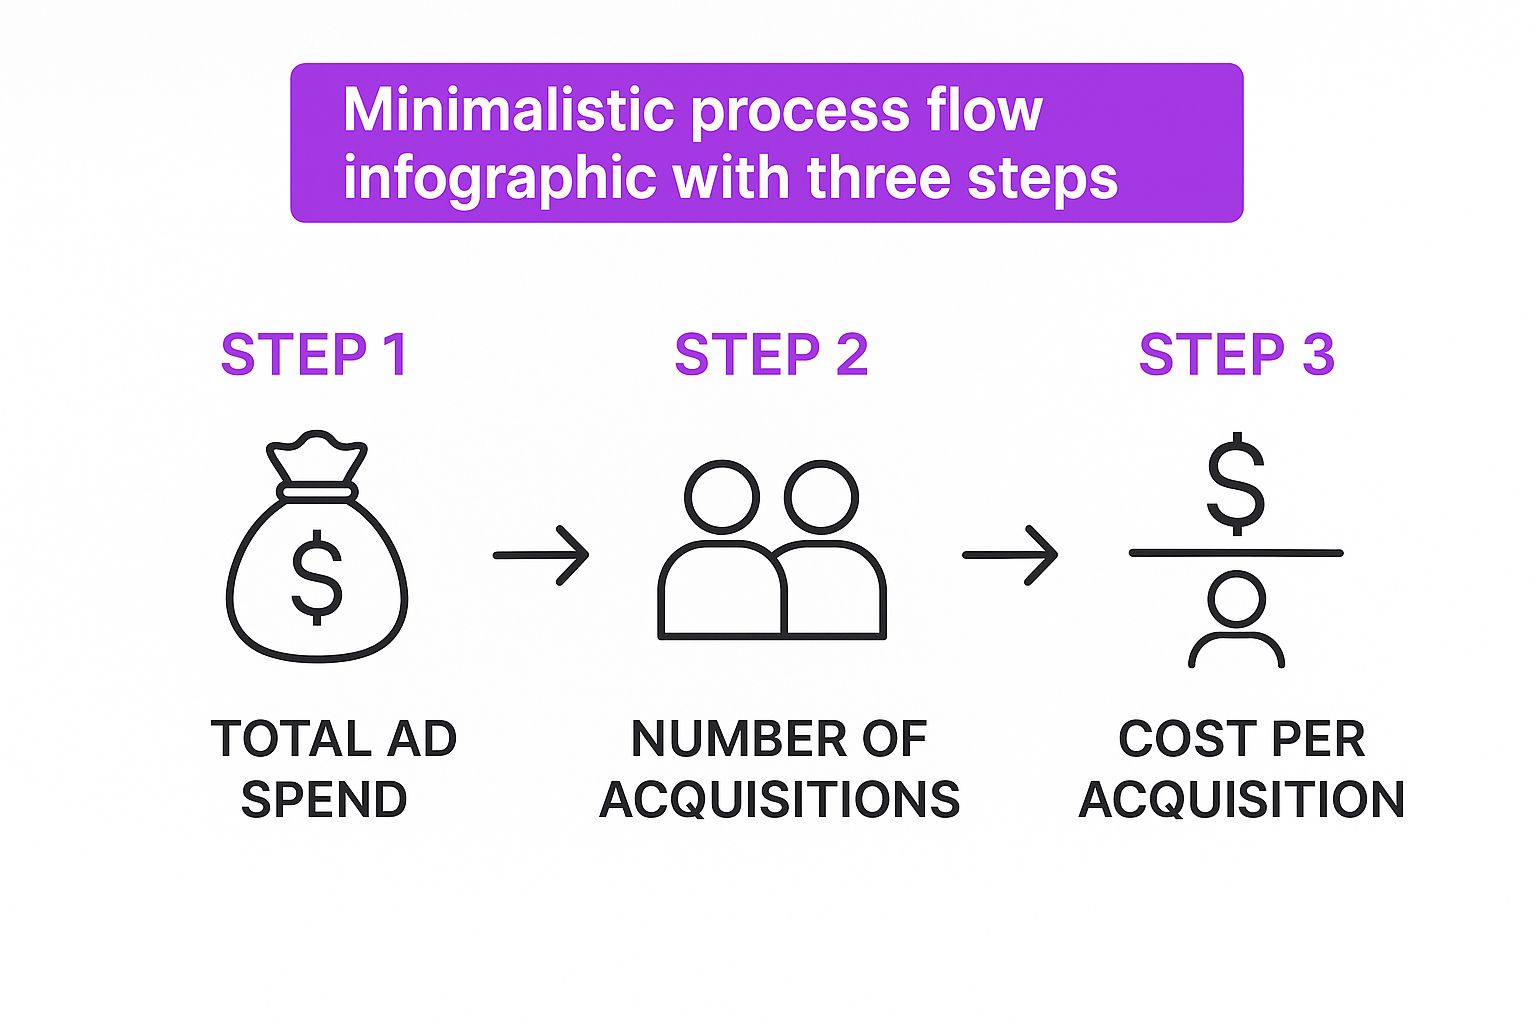
As the graphic shows, the flow is pretty straightforward. You take your total campaign spend, divide it by the number of new customers you brought in, and there you have it: your cost per acquisition.
Example 1: The Ecommerce Store
First up, let's picture a Shopify store called "Modern Threads" that sells custom t-shirts. In June, they ran a Google Shopping campaign specifically to attract first-time buyers.
Here’s a look at their total costs for that month:
- Google Ads Spend: $4,000
- Shopify Plan: $39
- Canva Pro for Ad Creatives: $15
- Total Monthly Cost: $4,054
During that same period, their Google Analytics 4 data (filtered for new users) showed they snagged 212 new paying customers directly from that campaign.
Now, let's plug those numbers into our formula:
$4,054 (Total Costs) ÷ 212 (New Customers) = $19.12 CPA
So, for Modern Threads, it costs $19.12 to bring in a new customer via their Google Shopping ads. This figure is now their benchmark—the number to beat next month.
Example 2: The SaaS Company
Next, we have "SyncUp," a B2B SaaS company with a project management tool. For them, an immediate sale isn't the goal. Instead, they want qualified leads to sign up for a product demo. An "acquisition" here is a completed demo request form.
Their LinkedIn content marketing campaign in Q3 had these expenses:
- LinkedIn Ad Spend: $7,500
- Content Writer (Freelance): $1,500
- HubSpot Subscription (Marketing Hub): $800
- Total Quarterly Cost: $9,800
Over the course of Q3, this campaign drove 95 qualified demo requests.
Remember, the definition of "acquisition" is flexible. For SyncUp, a demo request is the key conversion event that moves a prospect into their sales pipeline, making it the most logical "A" for their CPA calculation.
Here’s the math for SyncUp:
$9,800 (Total Costs) ÷ 95 (Demo Requests) = $103.16 CPA
SyncUp now knows it costs them just over $103 to get a potential customer to raise their hand and request a demo. The next step is to track how many of these leads actually convert to paying customers, which will tell them if this CPA is truly profitable.
Example 3: The Local Service Business
Finally, let’s look at "Oakwood Plumbing," a local business using Facebook Ads to get homeowners to book appointments. For a plumber, a successful acquisition is a confirmed appointment locked into their scheduling system.
Their Facebook campaign costs for July were:
- Facebook Ad Spend: $1,200
- Scheduling Software (Calendly): $25
- Total Monthly Cost: $1,225
The campaign brought in 35 new appointment bookings.
The calculation is crystal clear:
$1,225 (Total Costs) ÷ 35 (Booked Appointments) = $35 CPA
Oakwood Plumbing knows it costs $35 to get a new client on the calendar. This lets them immediately weigh that cost against the average revenue from a service call to see if their Facebook campaigns are making them money.
Benchmarking Your CPA Against the Market
So you've calculated your Cost Per Acquisition. Great. But that number—whether it's $10 or $1,000—is just a piece of data floating in a void. To turn it into real business intelligence, you have to give it context by benchmarking it against the rest of the market.
It's more important than ever to understand how your CPA stacks up. If your acquisition costs feel like they're creeping up, you're not imagining things. Globally, Customer Acquisition Costs (CAC) shot up by a staggering 222% between 2013 and 2021.
Even more telling, the average loss per newly acquired customer ballooned from $9 to $29 during that same period. This points to a huge and growing inefficiency in how companies are deploying their marketing budgets.
What Makes a "Good" CPA?
Let’s get one thing straight: a "good" CPA is completely relative. It all comes down to your specific industry, business model, and, most importantly, your profit margins.
A SaaS company might be popping champagne with a $400 CPA if their customer lifetime value (LTV) is $5,000. On the other hand, an ecommerce store selling $50 t-shirts would go under in a hurry with that same acquisition cost.
The goal isn't just to get a low CPA; it's to secure a profitable CPA. This means your cost to acquire a customer has to be sustainably lower than the revenue that customer brings in. To start figuring out where you stand, you need to look at:
- Industry Standards: What are your direct competitors likely paying to get a new customer?
- Profit Margins: How much breathing room do you have before a sale becomes unprofitable?
- Customer Lifetime Value (LTV): How much is one customer really worth to your brand over time?
Finding Industry Averages
Okay, so where do you find these all-important benchmarks? While every business is a little different, industry reports are the perfect place to start. They give you a realistic snapshot of what other brands in your space are spending.
To give you an idea, let's look at average customer acquisition costs across different ecommerce sectors.
This kind of data immediately shows that what a travel company considers a "good" CPA will be worlds away from a retail brand's target.
Average eCommerce Customer Acquisition Cost (CAC) by Industry
To help you benchmark your own performance, here’s a quick look at average Customer Acquisition Costs across different ecommerce sectors.
Source: Varies based on multiple industry reports and studies.
Using these averages helps you set realistic goals and get a feel for whether your performance is ahead of the curve, on par, or lagging behind the competition.
While we're talking about CPA and CAC, it's worth noting they're often used interchangeably but have key differences. For a more detailed breakdown and to add another layer of precision to your analysis, check out our complete guide on how to calculate customer acquisition cost.
Actionable Strategies to Lower Your CPA
Knowing your Cost Per Acquisition is one thing. Actively lowering it is where you start making real money. A high CPA isn't a dead end; it’s a signal—an opportunity to get smarter with your marketing. The goal here is to trim the fat from your acquisition costs without stunting your growth, making every single marketing dollar pull more weight.

This whole process is a balancing act. It involves fine-tuning who you talk to, what you show them, and how ridiculously easy you make it for them to buy from you. You’d be surprised how small, strategic tweaks can lead to massive savings and a much healthier marketing ROI.
Sharpen Your Audience Targeting
One of the fastest ways to slash your CPA is to stop throwing money at people who will never buy. It’s that simple. The more precise your targeting, the better your conversion rate, which in turn directly pushes down your acquisition cost.
Ditch the broad, shotgun approach and get granular. Dive into your data and build lookalike audiences from your best existing customers—not just all of them. This focuses your ad spend on prospects who share the same traits as your most profitable buyers.
And don't sleep on negative audiences. Actively tell your ad platforms to exclude demographics, interests, or locations that consistently give you low engagement or, worse, zero conversions. Every dollar you don't spend on an unlikely buyer is a dollar saved.
Pro Tip: Remember that your CPA doesn't exist in a vacuum. Industry benchmarks for Customer Acquisition Cost (CAC) can vary wildly. For example, the Jewelry industry often sees a high CAC of around $91, while Food & Beverage is much lower at $53. Knowing where your industry stands gives you crucial context for setting your own realistic CPA goals.
Optimize Landing Page Conversion Rates
Your ads can be world-class, but if your landing page is leaky, your CPA will be through the roof. A seamless, persuasive landing page experience isn't just nice to have; it's non-negotiable for an efficient marketing funnel.
Start by making sure your landing page message perfectly mirrors your ad copy. A disconnect between what the ad promises and what the page delivers is one of the biggest reasons for high bounce rates. The user's journey from click to conversion needs to feel like a single, frictionless thought.
Get into a regular A/B testing rhythm for these key elements:
- Headlines: Test different value propositions. What really grabs their attention?
- Call-to-Action (CTA): Play with button color, text ("Buy Now" vs. "Get Yours Today"), and placement.
- Page Layout: Simplify the design. Remove anything that distracts from the main goal: conversion.
Think about it: even a small lift in your conversion rate—say, from 2% to 3%—can cut your CPA by a third without you spending a single extra penny on ads.
Focus on Retention and Lifetime Value (LTV)
This might feel like a long-term play, but focusing on customer retention has a powerful, if indirect, effect on your acquisition costs. When you have a high Customer Lifetime Value (LTV), you simply have more wiggle room to spend on acquiring new customers profitably.
When your customers stick around and make repeat purchases, that initial cost to acquire them gets spread over a much larger revenue base. This is what allows you to maintain a healthy LTV-to-CPA ratio, which is a key sign of sustainable, scalable growth. A strong retention strategy makes your entire acquisition machine more resilient. To dive deeper, check out our guide on how to scale your ecommerce business with a solid growth strategy.
Got Questions About CPA? We’ve Got Answers.
As you start digging into your marketing numbers, a few common questions always seem to surface. Getting clear, practical answers is the key to moving from just calculating metrics to truly understanding what they mean for your business.
Let's clear up some of the most frequent points of confusion.
What's the Real Difference Between CPA and CAC?
It’s easy to see why people use these terms interchangeably, but there's a crucial distinction you need to know.
Customer Acquisition Cost (CAC) is all about the bottom line. It measures the total cost to land a new paying customer. Think of it as a big-picture business metric focused squarely on a sale.
Cost Per Acquisition (CPA), on the other hand, is much more flexible. It can track the cost of any specific action you decide is important. This could be a lead, a free trial sign-up, or an ebook download—not just the final purchase. The goal of your campaign is what defines the "Acquisition" in CPA.
A simple way to think about it: if someone signs up for a free Netflix trial, that's a CPA. The moment they pay for their first month, that cost becomes part of your overall CAC.
How Often Should I Be Calculating My CPA?
There's no magic schedule here. The right frequency really depends on the pace of your business and how quickly your campaigns move.
If you’re running a high-volume ecommerce store with daily deals, calculating your CPA on a weekly or even daily basis makes a lot of sense. It allows you to make quick, smart adjustments to your ad spend and creative.
But for a B2B SaaS company with a six-month sales cycle, looking at CPA daily would be a waste of time—the numbers would be all over the place. A monthly or quarterly calculation gives you a much more stable and strategic view, smoothing out those short-term bumps.
So, What's a Good CPA?
This is the million-dollar question, and the answer is always the same: it depends. A "good" CPA isn't some universal number; it's any number that is profitable for your business.
The most important relationship to keep an eye on is your CPA versus your Customer Lifetime Value (LTV). For a business model to be sustainable, your LTV needs to be significantly higher than your CPA. A common rule of thumb is aiming for a ratio of at least 3:1.
For example, a SaaS business could be incredibly successful with a $300 CPA if its average customer brings in $3,000 in lifetime value. But an online t-shirt shop selling $50 tees would go bankrupt in a heartbeat with that same acquisition cost. Your target CPA is dictated entirely by your own revenue and profit margins.
At ECORN, we help brands build profitable and scalable ecommerce operations by optimizing every aspect of their marketing funnel, from acquisition to retention. If you're ready to turn your data into a growth engine, explore our flexible Shopify solutions.


Unified Commerce Platform: Benefits, KPIs & Shopify Guide
How to Reduce Bounce Rate eCommerce: Your 2026 Guide
Shopify API Integration: A Practical End-to-End Guide
How to Implement Data Governance: A 2026 Guide
Shopify Store Development Cost: A 2026 Breakdown
What Is Server Side Tracking: The Shopify Guide 2026
Marketing Automation Workflows: A Shopify Guide for 2026

Shopify: How to Reduce Technical Debt

Shopify UX Design Change: A Playbook for Growth
User Generated Content Strategy: Shopify Playbook

Shopify Pause and Build Plan Cost: A Complete 2026 Guide
Compare at Price on Shopify: A Complete Guide for 2026
Where Can I Sell My Prints? 10 Best Platforms for 2026
Shopify Order Management System: The Ultimate Guide 2026
What Is Marketing Attribution? an eCommerce Guide for 2026

10 Best Black Friday Sales Sheets for 2026

Discover the Top Social Media Marketing Agencies For
Consumer Confidence Definition for eCommerce in 2026
What Is Social Commerce? Your 2026 Guide to Boosting Sales
A Social Ad Campaign Playbook for eCommerce Growth
7 Best FAQ Page Examples for SaaS & eCommerce

Market Research in Fashion Industry: A Guide for Shopify

Shopify Migration Services: Expert Guide for 2026
Mastering FB Retargeting Ads for Shopify in 2026
What Is Omnichannel Ecommerce

Master Your Shopify Plus Migration: The 2026 Guide
Shopify Integration Services: A Merchant's 2026 Guide
Shopify Collection Description: A Guide to SEO & Sales
Shopify Plus Contact: Reach Sales & Support Effectively

Top Luxury Shopify Stores: Design & UX Strategies
How to Improve Customer Experience: A Shopify Roadmap
Creative Facebook Ads: 10 Examples for Shopify Brands

Remarketing with Facebook Ads: A Shopify Guide for 2026

SEO Linking Strategies for Shopify Stores
Top 7 Statistics YouTube Channels for eCommerce in 2026

Hiring Shopify Plus Designers: A Founder's Guide
Shopify Product Variation: Master Your Variants for 2026

Leverage Ai Solutions Brands: Your 2026 Shopify Growth Guide

Filters in Shopify: A Guide for Growing Brands

Shopify Plus Developer: A Guide for Growing Brands

When Does Black Friday Online Start? A 2026 Guide
Black Friday Email Marketing: Shopify & Klaviyo Guide

Polaris Design System: The Complete Shopify Guide

How to Hire a Consultant Email Marketing Expert

What Is Q4? A Shopify Merchant's Guide to Peak Season

Marketing Organization Structure for eCommerce Growth
Top Account-Based Marketing Agency Guide for 2026

7 Remarketing Ad Examples for Your 2026 Campaigns

AI Retail Solutions: Boost Your Shopify Store

Migrate to Shopify: The Definitive 2026 Guide

Shopify Authentication App: A Guide for Secure Stores
Why Strategic Marketing Is Important for Growth in 2026

How to Create a Size Chart in Shopify: 2026 Guide

Shopify Themes for Jewelry: The Definitive 2026 Guide

Minimal Shopify Templates: Faster, Higher-Converting Stores
Maximize Profit: Shopify CC Fees 2026 Guide

Best Shopify Apps for Beginners in 2026

How to Improve Online Shopping Experience in 2026

Shopify Design and Development Services: A 2026 Guide

Small Business Social Media Marketing Agency: A Hiring Guide

Bulk Edit Shopify: A Guide to Save Hours on Store Updates

2026 Trends in Food and Beverage Industry

Post Purchase Survey Guide for Shopify Stores

How to Build an Ecommerce Brand in 2026
Conversion Rate Optimization for Ecommerce: Maximize Profit
How to Use Customer Data to Increase Sales: A Guide
Shopify for Enterprise: The 2026 Deep Dive Guide

Email Marketing Agencies: The Guide for Shopify Brands
Boost Sales With The Right Shipping Shopify App

Your Guide to the Shopify Site Map
7 Headless Commerce Examples for 2026

Mastering Trends in Cosmetic Industry for 2026
Transfer Shopify to BigCommerce The Complete 2026 Playbook

What Is Shopify Collective? Your 2026 Guide to Success
Unlock Shopify Growth with Site Link SEO
Integrating Shopify and WordPress A Complete Guide for 2026

Naming a Clothing Store: A Shopify Founder's Playbook

Guide to buying shopify store in 2026

Buying shopify store: Buying a Shopify Store: Invest Wisely

Food & Beverage Marketing: A Complete Guide for 2026
Facebook Ads Agency: A Shopify Brand's Hiring Guide

Shopify Apparel Stores: A 2026 Launch & Scale Guide
How to Deactivate Shopify Store: The 2026 Guide
Shopify and Square: The 2026 Ultimate Comparison
Your Guide to Beauty Products Ecommerce

A Guide to Marketing for Beauty Brands in 2026
Your Guide to Facebook Black Friday Ads
Facebook Ad Ecommerce for Shopify Growth

Iconography Web Design The Definitive Guide for Shopify Stores

A Modern Backlinks SEO Strategy for Shopify Stores

How to Launch an Online Store: A Step-by-Step Success Guide
Optimize Shopify Store: Master Performance in 2026

Successful Migration for Shopify: Protect SEO & Grow

Maximize Traffic & Sales: Get Your Free Website Audit Report
Master the Best Ads Facebook Formats for eCommerce Success

How to Find the Best Ecommerce Agency Near Me in 2026
10 Crucial White Hat Techniques SEO for Shopify in 2026
How to Reduce Returns and Boost Profits in Your eCommerce Store
What Is Ecommerce Personalization A Guide to Unlocking Growth
Payment gateways in shopify: The Ultimate Guide for Merchants 2026


newsletter in your inbox