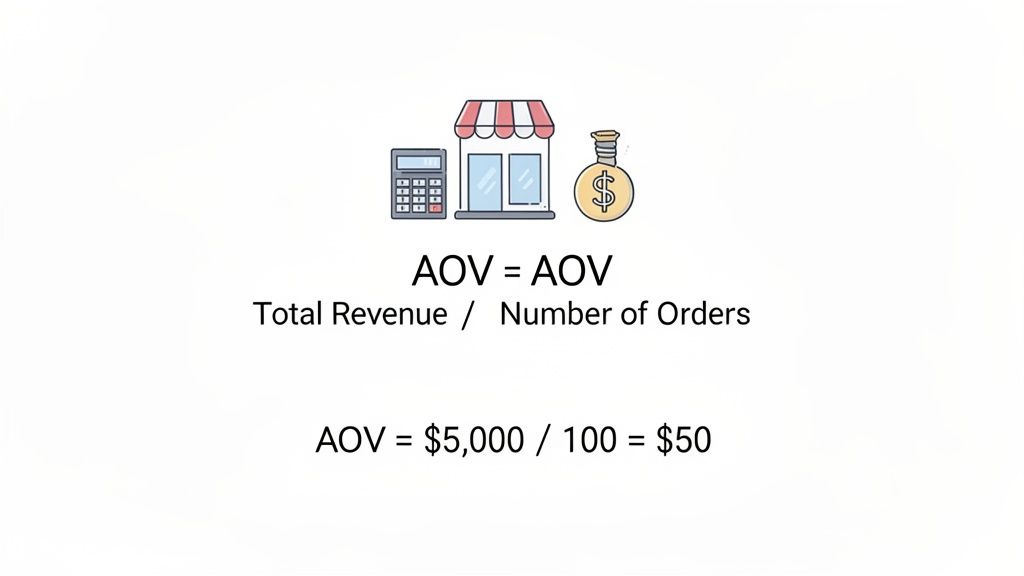
Calculating your Average Order Value (AOV) is one of the quickest ways to take the pulse of your eCommerce store. The math itself couldn't be simpler: just divide your total revenue by the total number of orders you received over a specific time period.
For example, if you brought in $50,000 from 1,000 orders last month, your AOV is a neat $50.
Your Starting Point for Calculating Average Order Value
Knowing your AOV is far more than a simple math exercise. It's the bedrock for making smarter, more strategic decisions about your business. This one metric tells you exactly how much the average customer spends in a single transaction, which has a massive ripple effect on your profitability, marketing budget, and overall growth plans. Think of it as a vital sign for your store’s financial health.
This calculation is especially critical for brands pouring money into paid traffic on platforms like Meta, Google, or TikTok. Let’s say your cost per acquisition (CPA) is $25, but your AOV is only $30. After you factor in the cost of your products, you're likely operating on razor-thin margins—or even losing money on each new customer. AOV gives you the essential context to evaluate your return on ad spend (ROAS) and determine if your acquisition efforts are actually sustainable.
Breaking Down the AOV Formula
The beauty of the AOV formula is its simplicity. You only need two key data points, which you can easily pull from your eCommerce platform, whether it’s Shopify or BigCommerce.
To make this even clearer, let's break down the components.
AOV Formula Components at a Glance
This table offers a quick reference for the two main inputs you'll need to calculate your Average Order Value.
With these two numbers, you're ready to get your baseline AOV.
Let’s walk through a real-world scenario. Imagine a Shopify store generated $150,000 in revenue from 2,000 orders last month.
The calculation is straightforward: $150,000 ÷ 2,000 = a $75 AOV.
This simple formula gives you a clear baseline for customer spending habits and unlocks a deeper level of strategic thinking. You can explore more eCommerce metrics and how they connect with average order value on opensend.com.
Once you know this number, you can start asking the right questions. Is a $75 AOV high enough to support your marketing spend? What small changes could you test to nudge that number closer to $85? This is where AOV transforms from a simple metric into a powerful lever for growth.
Calculating Your AOV With Real-World Data
Alright, let's move from theory to practice. This is where the real insights start to pop. Knowing the AOV formula is one thing, but applying it to your actual sales data is how you'll find those golden nuggets for growth.
Luckily, platforms like Shopify and Google Analytics make this pretty painless. They already consolidate the two key numbers you need: total revenue and total orders.
If you're on Shopify, you're just a few clicks away. Head over to the Reports section in your dashboard for a clear overview of sales performance. You can dial in specific date ranges—like the last 30 days or the most recent quarter—to pull the exact figures for your calculation.
For a really deep dive into your store's performance metrics, our guide on mastering the Shopify Analytics dashboard can give you a ton more context.
Finding Your Data in Shopify
Once you're in the reports, you'll want to find the Sales over time report. This is your go-to. It neatly lays out your net sales (that's the revenue figure you want to use) and the total number of orders for whatever period you've selected.
Here’s a snapshot of what you might see.
As you can see, Shopify often calculates AOV for you. But knowing how to do it yourself is essential for any custom reporting or deeper analysis when you start segmenting your data.
Real-World AOV Calculation Scenarios
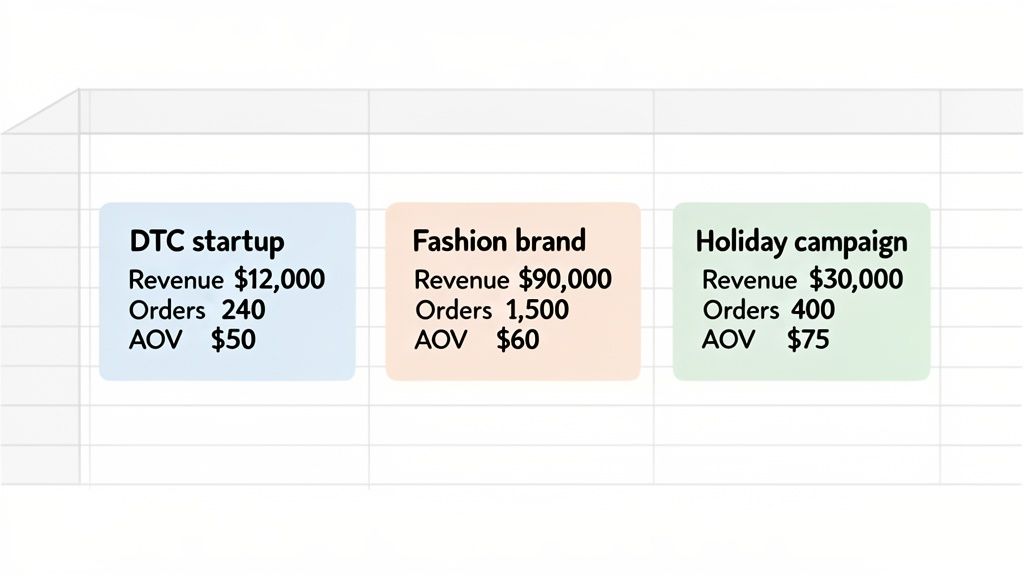
Let's walk through three different business scenarios to see this in action. Each example uses unique data, showing how AOV can inform very specific business goals.
Scenario 1: The DTC Startup’s Monthly Baseline
A new wellness brand just wrapped up its first full month and needs to establish its baseline AOV. This number is critical for setting its initial marketing budget and figuring out profitability.
- Total Revenue (May): $18,500
- Total Orders (May): 400
- Calculation: $18,500 ÷ 400 orders = $46.25 AOV
This tells the startup that, on average, a customer spends $46.25. Now they have a benchmark. They can start testing strategies like product bundles or setting a free shipping threshold just above that mark—say, at $50—to encourage a bigger cart size.
Scenario 2: The Fashion Brand’s Seasonal Trend Analysis
An established apparel company wants to see how seasonality affects what people buy. They decide to compare Q4 (the holiday rush) with Q1 (the post-holiday slump) by calculating the AOV for each.
- Total Revenue (Q4): $2,500,000
- Total Orders (Q4): 25,000
- Calculation: $2,500,000 ÷ 25,000 orders = $100 AOV
When they run the numbers for Q1 and find an AOV of $85, the story becomes clear. Customers are definitely willing to spend more during the holiday shopping frenzy, which completely validates ramping up their ad spend in Q4.
Analyzing AOV across different timeframes transforms it from a static number into a dynamic indicator of customer behavior. It helps you spot trends, measure campaign impact, and make smarter inventory and marketing decisions year-round.
Scenario 3: The Holiday Campaign ROI Measurement
A large home goods retailer just finished a massive, week-long Black Friday campaign. They want to know if it was truly successful, so they compare the campaign's AOV to their yearly average.
- Campaign Revenue (Black Friday Week): $750,000
- Campaign Orders: 6,250
- Calculation: $750,000 ÷ 6,250 orders = $120 AOV
Their yearly AOV sits at $95. This means the campaign didn't just drive a ton of sales; it successfully increased the average spend by over 26%. That's concrete proof that the campaign generated more profitable orders, not just more of them.
Why a Single Store-Wide AOV Can Be Misleading
Knowing your store-wide average order value is a decent starting point, but if that's the only number you're looking at, you're flying blind. A single, blended AOV can easily mask serious problems and hide your absolute best growth opportunities.
Think of it this way: a "healthy" overall AOV on your dashboard might look fine, but it often averages out your high-performing customer segments with ones that are barely breaking even—or worse, bleeding money. To really understand what’s driving your business, you need to dig deeper.
This is where segmentation comes in. By breaking down your AOV, you can stop making decisions based on vague averages and start using precise data to drive your strategy. It’s like a doctor checking vital signs; a normal body temperature doesn't tell the whole story if the patient's blood pressure is through the roof.
Segmentation lets you calculate AOV for specific slices of your audience, giving you a much sharper picture of what's actually happening.
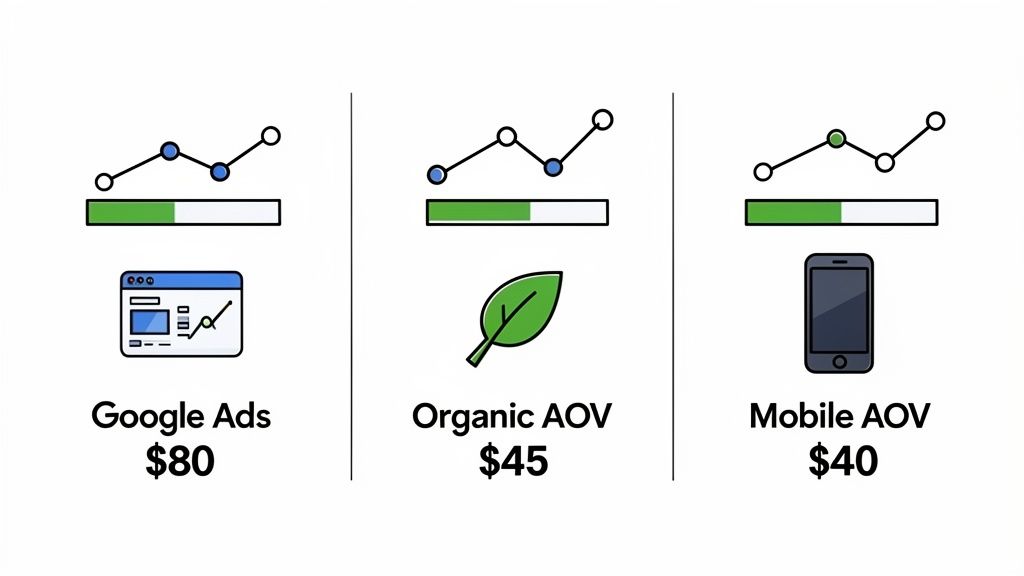
Analyzing AOV by Traffic Source
Let's be clear: not all traffic is created equal. Your AOV data will prove it. Customers arriving from different channels often have completely different buying intentions and behaviors. Calculating AOV by source is how you identify your most profitable channels and stop wasting your ad spend.
Imagine your store has a blended AOV of $70. On the surface, that might seem okay. But once you segment it, a new story emerges:
- Google Ads AOV: $95
- Organic Search AOV: $75
- Social Media AOV: $40
Suddenly, the picture is crystal clear. Customers from Google Ads are high-value, while visitors scrolling through social media are placing much smaller orders. This insight is gold. You might decide to double down on your Google Ads budget or, for your social audience, create specific, lower-priced bundles that are easier to impulse-buy.
The Critical Role of Device Segmentation
In today's market, segmenting by device isn't just a good idea—it's essential. The experience of browsing on a desktop is fundamentally different from a mobile phone, and this gap almost always shows up in the numbers.
While the AOV formula itself doesn't change, interpreting it correctly means looking at how different devices perform.
For example, data consistently shows that desktop orders have a significantly higher AOV than mobile. For many eCommerce stores, a blended AOV of $120 might actually be hiding a desktop AOV closer to $160 while the mobile AOV struggles under $100. This trend is reflected in broader U.S. eCommerce statistics you can explore on shiptothemoon.com.
A discrepancy this large often points to friction in the mobile checkout process or just a clunky browsing experience on smaller screens.
By not segmenting your AOV, you’re missing the full story. You could be misattributing success to the wrong channels or completely fail to notice a glaring issue—like a broken mobile checkout flow—that is silently costing you thousands in revenue.
Segmenting AOV by Customer Location
Geographic segmentation is another powerhouse tool, especially if your brand has an international presence. Things like purchasing power, cultural buying habits, and shipping costs can all create huge variations in AOV from one region to another.
Let's take a brand that sells in both the United States and Europe.
- United States AOV: $110
- European Union AOV: €80 (which is about $88)
This kind of data can guide massive strategic decisions. You'll know where to run promotions, which currencies to prioritize for a localized experience, and how to set market-specific free shipping thresholds. It moves you from a clumsy, one-size-fits-all approach to a smarter, localized strategy that actually meets customers where they are.
Common Mistakes That Skew Your AOV Calculation
An accurate Average Order Value is a powerful tool, but let's be honest—it's only as good as the data you feed it. Even small calculation errors can snowball, leading you to make strategic decisions based on a completely skewed picture of your business.
Think of it like a GPS with the wrong starting address. It'll give you directions, but they definitely won’t get you where you need to go. Many common slip-ups can artificially inflate or deflate your AOV, giving you a false sense of security or, even worse, a false sense of panic. Before you can trust the insights, you have to trust the numbers.
Including Extra Fees in Revenue
This is probably the most frequent mistake I see. It's so easy to just pull the "total sales" number and run with it, but that often includes shipping fees and taxes. While that money technically passes through your business, it's not revenue you've earned from your products.
Including these fees will always inflate your AOV, masking what customers are actually spending on your items.
For instance, if a customer buys a $45 product and pays $5 for shipping, the revenue for your AOV calculation should be $45, not $50. Always stick to your net sales or net revenue. This gives you a pure, unfiltered look at how much customers are willing to spend on the things you sell.
The whole point of tracking AOV is to understand customer purchasing habits for your products. Fees like shipping, taxes, or duties are just transactional costs; they don't reflect a customer's intent to spend more with your brand.
Forgetting About Returns and Refunds
Here's another big one. A sale isn't really a sale until the return window has slammed shut. If you calculate your AOV using gross sales data the moment an order is placed, you're counting revenue that might just be heading back out the door a week later.
Imagine your store pulled in $100,000 in gross sales last month—looks great on paper. But what if you had $8,000 in returns and refunds? Your actual net revenue was only $92,000. Using that inflated $100,000 figure will give you an overly optimistic AOV, which could trick you into overspending on marketing campaigns based on faulty assumptions.
The fix is simple: make sure you subtract all refunds and returns from your total revenue for the period you're analyzing. This gives you a much more conservative and realistic AOV that truly reflects your store's financial performance.
Comparing Inconsistent Time Periods
Trying to compare your AOV from Black Friday week to a quiet week in February is like comparing apples and oranges. It just doesn't work. The customer mindset, the discounts you're running, and the general sense of urgency are worlds apart. It's a classic mistake that leads to completely flawed conclusions.
Your analysis is only as valuable as the comparisons you make. For a clear-eyed view of your trends, you have to be consistent.
- Month-over-month: Look at May versus April.
- Year-over-year: Compare Q2 of this year to Q2 of last year.
- Campaign-to-campaign: Analyze the AOV from this year's holiday promotion against last year's.
By maintaining this discipline, you can spot genuine shifts in customer spending instead of misinterpreting a seasonal spike as a long-term behavioral change. It ensures your big strategic moves are based on solid, comparable data.
Actionable Strategies to Increase Your Average Order Value
Alright, you've got the hang of calculating your AOV and slicing the data for some real insights. Now for the fun part: turning that knowledge into more revenue. Think of your AOV calculation as a roadmap—it points directly to opportunities where you can encourage customers to happily spend a little more per order. This isn't about being pushy; it's about adding real value at just the right moment.
This has become a critical focus for store owners, especially with customer acquisition costs creeping up year after year. Every dollar you spend to get a new customer needs to work harder. Considering global retail ecommerce sales are expected to hit around $6.86 trillion by 2025, even a tiny lift in your AOV can make a massive difference to your bottom line. Getting more from each transaction is one of the smartest ways to scale profitably.
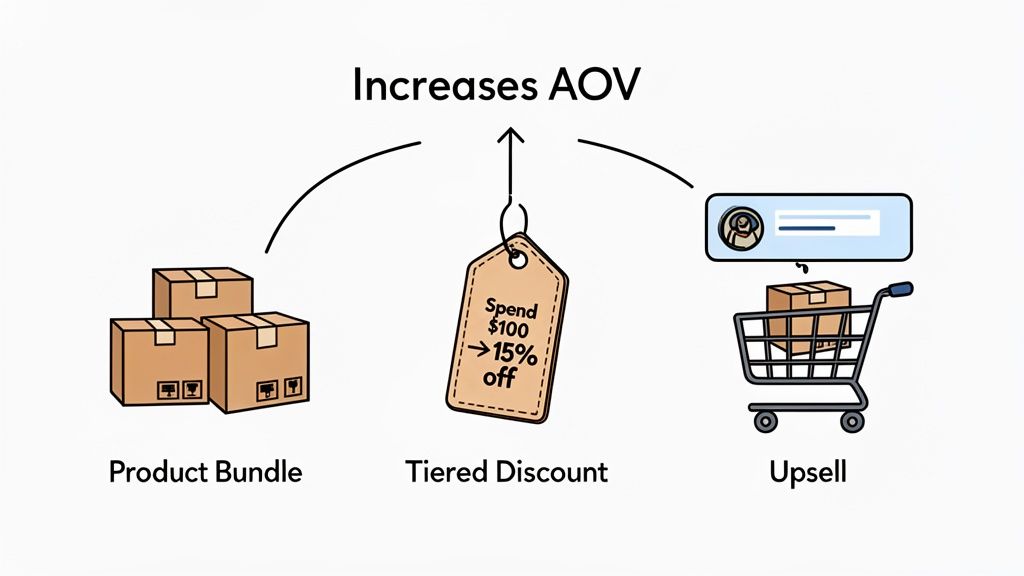
Create Compelling Product Bundles
One of the quickest wins for bumping up AOV is product bundling. It works so well because it feels like a better deal to the customer and makes their decision easier. You're not just selling a product; you're offering a complete solution.
Take a skincare brand, for example. Selling a moisturizer is good. But bundling that moisturizer with its matching cleanser and serum for a slight discount? That's a no-brainer for the customer. They get a full routine, and you get a healthier order value.
- Example: A coffee company could package a bag of their house blend, a quality grinder, and a pair of branded mugs. It’s the perfect starter kit for a new coffee lover and instantly lifts the total sale value.
Implement Tiered Discounts and Free Shipping Thresholds
This is a classic for a reason—it works. Setting up tiered discounts like "Spend $75, Get 10% Off" or "Spend $100, Get 15% Off" gives customers a clear incentive to add more to their cart. It turns shopping into a bit of a game where they feel like they're winning by unlocking a better deal.
A free shipping threshold is just as powerful, especially when you set it just above your current AOV. If you know your typical customer spends $45, offering free shipping at $50 is often all it takes to convince them to grab one more small item. Suddenly, that shipping fee feels like wasted money.
The trick is to make the next spending level feel both achievable and worthwhile. The customer should feel smart for spending a little more, not pressured.
Optimize In-Cart and Post-Purchase Upsells
Upselling has a bad rap, but when done right, it feels like a helpful suggestion, not a hard sell. Modern ecommerce platforms have made it incredibly easy to show complementary items or popular add-ons right in the cart or on the checkout page.
Post-purchase upsells are my personal favorite. They don't interrupt the initial sale, which is crucial. Once the customer has already committed and completed their purchase, you can show them a simple one-click offer for a related product. It's a frictionless way to add to the order. To see how this applies in other contexts, check out these tips on how to increase average order value in crowdfunding.
Today, AI-powered recommendation engines can make these suggestions hyper-relevant by looking at a user's browsing history and what's in their cart, which seriously boosts the chances of a successful upsell.
For a deeper dive into all of these tactics and more, take a look at our complete guide on how to increase average order value with proven strategies.
A Few Common Questions About Calculating AOV
Even with a clear formula, you'll always run into some tricky edge cases when you start digging into your own Average Order Value. We've been there. So, we've gathered the most common questions we hear from founders and marketers to give you quick, straightforward answers.
Should Shipping Fees and Taxes Be Included When I Calculate AOV?
Nope. You'll want to exclude shipping fees, taxes, and any discounts from your total revenue figure. For the most accurate and useful calculation, your goal is to use your net revenue.
Including those extra costs just inflates your AOV, giving you a fuzzy picture of how much customers are actually spending on your products. The whole point is to understand customer spending habits on the things you sell, and things like shipping costs just muddy the waters.
How Often Should I Calculate My Average Order Value?
How often you run the numbers really comes down to your business's natural rhythm and what you're trying to achieve. As a baseline, calculating AOV on a monthly and quarterly basis is a great way to spot high-level trends and track growth over time. This helps you get a feel for things like seasonality and the general health of your store.
But for more immediate, actionable insights, you should absolutely be calculating it for specific, shorter timeframes. For instance:
- Right after launching a marketing campaign to see its direct impact on spending.
- During a holiday sale (like Black Friday) to find out if your promotions are actually leading to bigger carts.
- After you roll out a new upselling feature to get a quick read on whether it's working as expected.
The most powerful AOV analysis comes from comparing apples to apples. Calculating your AOV for specific events gives you the clean data you need to know what's truly moving the needle.
My AOV Is Lower Than the Industry Benchmark. What Should I Do First?
First off, don't panic. Before you do anything, make sure you're looking at a benchmark that actually makes sense for your business. An AOV for a luxury watch brand isn't a useful comparison for a store selling posters.
Once you’ve confirmed the benchmark is a fair one, your very first move should be to segment your AOV data.
Start by breaking down AOV by both traffic source and device type. One of the most common culprits for a low overall AOV is a poor mobile experience. If your site is clunky or the checkout process is a nightmare on smaller screens, it can seriously drag down your numbers. Digging into your mobile site's performance is often the highest-impact place to start.
What Is the Difference Between AOV and Customer Lifetime Value (CLV)?
This is a fantastic question. Both metrics are absolutely vital, but they tell you very different stories about your business.
- Average Order Value (AOV) is a transactional metric. It gives you a snapshot of a single purchase at one specific point in time. It's all about "how much did they spend right now?"
- Customer Lifetime Value (CLV) is a relational metric. It looks at the bigger picture, forecasting the total revenue you can expect from a single customer over their entire relationship with your brand.
In short, AOV helps you optimize what’s happening in the cart for individual sales, while CLV guides your long-term strategies for customer retention and acquisition.


How to Increase Customer Lifetime Value: A Shopify Playbook
AI Customer Service Automation: Shopify Guide 2026

Clean Website Design: A Shopify Conversion Playbook

Omnichannel Retail Strategy: A Shopify Playbook
Product Data Enrichment: A Guide for Shopify Brands

Instagram Shopping Features a Guide for Shopify Stores
What Is Revenue Optimization: A Holistic RevOps Guide

Benefits of Conversion Rate Optimization: Boost Your
WordPress to Shopify Migration: Your 2026 Seamless Switch
Boost Sales: Ecommerce Payment Processing Guide 2026

Unified Commerce Platform: Benefits, KPIs & Shopify Guide

How to Reduce Bounce Rate eCommerce: Your 2026 Guide
Shopify API Integration: A Practical End-to-End Guide

How to Implement Data Governance: A 2026 Guide

Shopify Store Development Cost: A 2026 Breakdown
What Is Server Side Tracking: The Shopify Guide 2026
Marketing Automation Workflows: A Shopify Guide for 2026

Shopify: How to Reduce Technical Debt

Shopify UX Design Change: A Playbook for Growth

User Generated Content Strategy: Shopify Playbook

Shopify Pause and Build Plan Cost: A Complete 2026 Guide

Compare at Price on Shopify: A Complete Guide for 2026

Where Can I Sell My Prints? 10 Best Platforms for 2026

Shopify Order Management System: The Ultimate Guide 2026
What Is Marketing Attribution? an eCommerce Guide for 2026

10 Best Black Friday Sales Sheets for 2026

Discover the Top Social Media Marketing Agencies For
Consumer Confidence Definition for eCommerce in 2026
What Is Social Commerce? Your 2026 Guide to Boosting Sales

A Social Ad Campaign Playbook for eCommerce Growth

7 Best FAQ Page Examples for SaaS & eCommerce

Market Research in Fashion Industry: A Guide for Shopify

Shopify Migration Services: Expert Guide for 2026

Mastering FB Retargeting Ads for Shopify in 2026
What Is Omnichannel Ecommerce

Master Your Shopify Plus Migration: The 2026 Guide
Shopify Integration Services: A Merchant's 2026 Guide
Shopify Collection Description: A Guide to SEO & Sales

Shopify Plus Contact: Reach Sales & Support Effectively

Top Luxury Shopify Stores: Design & UX Strategies
How to Improve Customer Experience: A Shopify Roadmap

Creative Facebook Ads: 10 Examples for Shopify Brands

Remarketing with Facebook Ads: A Shopify Guide for 2026

SEO Linking Strategies for Shopify Stores
Top 7 Statistics YouTube Channels for eCommerce in 2026

Hiring Shopify Plus Designers: A Founder's Guide

Shopify Product Variation: Master Your Variants for 2026

Leverage Ai Solutions Brands: Your 2026 Shopify Growth Guide

Filters in Shopify: A Guide for Growing Brands

Shopify Plus Developer: A Guide for Growing Brands

When Does Black Friday Online Start? A 2026 Guide
Black Friday Email Marketing: Shopify & Klaviyo Guide

Polaris Design System: The Complete Shopify Guide

How to Hire a Consultant Email Marketing Expert

What Is Q4? A Shopify Merchant's Guide to Peak Season

Marketing Organization Structure for eCommerce Growth

Top Account-Based Marketing Agency Guide for 2026

7 Remarketing Ad Examples for Your 2026 Campaigns

AI Retail Solutions: Boost Your Shopify Store

Migrate to Shopify: The Definitive 2026 Guide

Shopify Authentication App: A Guide for Secure Stores

Why Strategic Marketing Is Important for Growth in 2026

How to Create a Size Chart in Shopify: 2026 Guide

Shopify Themes for Jewelry: The Definitive 2026 Guide

Minimal Shopify Templates: Faster, Higher-Converting Stores
Maximize Profit: Shopify CC Fees 2026 Guide

Best Shopify Apps for Beginners in 2026

How to Improve Online Shopping Experience in 2026

Shopify Design and Development Services: A 2026 Guide

Small Business Social Media Marketing Agency: A Hiring Guide

Bulk Edit Shopify: A Guide to Save Hours on Store Updates

2026 Trends in Food and Beverage Industry

Post Purchase Survey Guide for Shopify Stores

How to Build an Ecommerce Brand in 2026
Conversion Rate Optimization for Ecommerce: Maximize Profit
How to Use Customer Data to Increase Sales: A Guide

Shopify for Enterprise: The 2026 Deep Dive Guide

Email Marketing Agencies: The Guide for Shopify Brands

Boost Sales With The Right Shipping Shopify App

Your Guide to the Shopify Site Map

7 Headless Commerce Examples for 2026

Mastering Trends in Cosmetic Industry for 2026

Transfer Shopify to BigCommerce The Complete 2026 Playbook

What Is Shopify Collective? Your 2026 Guide to Success

Unlock Shopify Growth with Site Link SEO

Integrating Shopify and WordPress A Complete Guide for 2026

Naming a Clothing Store: A Shopify Founder's Playbook

Guide to buying shopify store in 2026

Buying shopify store: Buying a Shopify Store: Invest Wisely

Food & Beverage Marketing: A Complete Guide for 2026

Facebook Ads Agency: A Shopify Brand's Hiring Guide

Shopify Apparel Stores: A 2026 Launch & Scale Guide

How to Deactivate Shopify Store: The 2026 Guide

Shopify and Square: The 2026 Ultimate Comparison

Your Guide to Beauty Products Ecommerce

A Guide to Marketing for Beauty Brands in 2026
Your Guide to Facebook Black Friday Ads
Facebook Ad Ecommerce for Shopify Growth

Iconography Web Design The Definitive Guide for Shopify Stores

A Modern Backlinks SEO Strategy for Shopify Stores


newsletter in your inbox