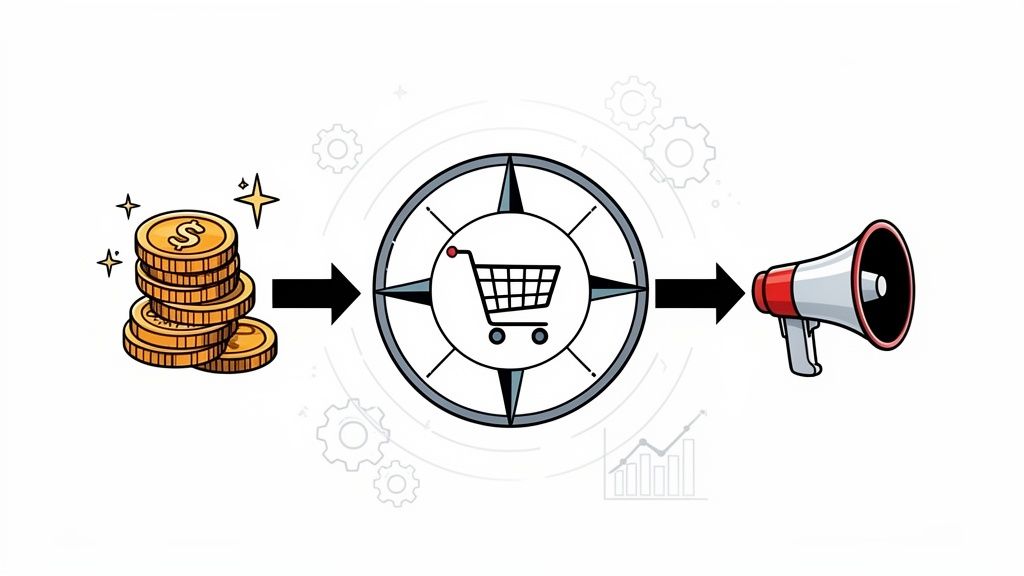
The marketing efficiency ratio (MER) is your one true north. It’s a beautifully simple metric that answers a profoundly important question: for all the money we’re spending on marketing, how much revenue is actually coming in? Think of it as the ultimate health check for your entire marketing engine.
What Is the Marketing Efficiency Ratio
Let's use an analogy. Imagine you're the captain of a large ship. On your control panel, you have dozens of gauges—one for engine RPM, another for propeller speed, another for rudder angle. Each one tells you something specific and important. That’s like Return on Ad Spend (ROAS). It’s great for measuring the performance of a single campaign or channel, like your Google Ads or your Meta retargeting.
But none of those individual gauges tell you if you're actually making progress toward your destination.
That's where MER comes in. MER is your ship's main navigation system. It zooms out from the individual engine metrics and gives you the big picture: "For all the fuel we've burned (total marketing spend), how many nautical miles have we covered (total revenue)?" It’s this holistic view that separates frantic activity from real, sustainable growth.
A Holistic Metric for a Complex World
In the cutthroat world of eCommerce, especially for Shopify brands, MER has become an absolute game-changer, really taking off around 2020. Its power lies in its simplicity: total revenue divided by total marketing spend. It gives you a clean, blended snapshot of performance across every single channel—paid social, search, email, influencers, you name it.
This is a world away from looking at ROAS in a vacuum. A high ROAS on a branded search campaign might look amazing on its own, but what if it was your expensive top-of-funnel TikTok ads that made people search for your brand in the first place? ROAS alone will never show you the true, blended cost of getting that customer. MER does.
The Marketing Efficiency Ratio is your source of truth. It cuts through the noise of platform-specific attribution and tells you one simple thing: is my overall marketing investment profitable?
MER and ROAS are often confused, but they serve very different strategic purposes. ROAS is tactical, perfect for optimizing a specific campaign, while MER is strategic, guiding your entire marketing budget and business goals.
Let's break down the key differences.
MER vs ROAS at a Glance
This table cuts right to the chase, showing how these two critical metrics stack up and where each one shines.
Seeing them side-by-side makes it clear: you don't choose one over the other. You use both. ROAS helps you tune the individual instruments, while MER tells you if the whole orchestra is playing a beautiful, profitable song.
Why MER Is the North-Star Metric for Growth
The smartest eCommerce brands are rallying around MER as their primary KPI, and for good reason:
- It Simplifies Complexity: Forget juggling dozens of separate reports. MER boils everything down to one number that tells you if your marketing is working as a whole.
- It Aligns Marketing with Business Goals: MER directly connects marketing dollars to top-line revenue. This forces the marketing team to focus on what truly matters—driving profitable growth, not just chasing vanity metrics like clicks or impressions.
- It Accounts for the Entire Ecosystem: Modern customer journeys are messy. A blog post might lead to an email signup, which then leads to a retargeting ad conversion. MER inherently understands and captures this combined impact.
By anchoring your strategy to this single, powerful metric, you can start making much smarter decisions about where to put your budget and how to grow your business profitably. To go even deeper, check out our complete guide on Mastering the Marketing Efficiency Ratio, which is packed with advanced strategies and benchmarks.
How to Calculate Your Marketing Efficiency Ratio
Calculating your Marketing Efficiency Ratio is way more straightforward than it sounds. You don't need a data science degree, that's for sure. At its heart, the formula is beautifully simple, giving you a powerful snapshot of your overall performance without getting tangled up in complex attribution models.
The core formula for MER is just this:
MER = Total Revenue / Total Marketing Spend
This calculation spits out a single, blended number that answers the most important question of all: for every dollar we put into marketing, how many dollars of total revenue came back out? It’s the ultimate report card for your entire marketing engine.
Think of it like this: your total revenue goes in one side of the machine, and your total spend goes in the other. What comes out is your MER.
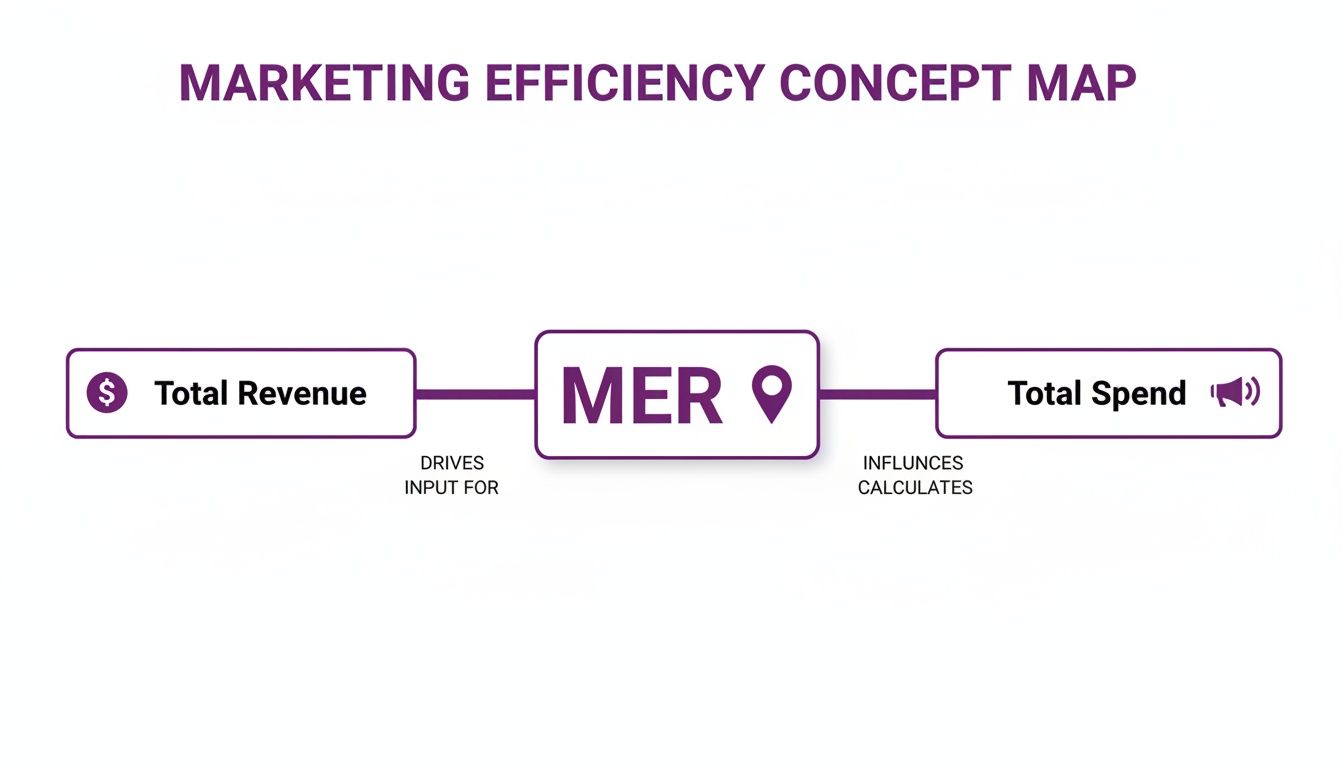
As the diagram shows, MER is the central checkpoint. It balances the total income you generated against the total cost it took to get there.
Defining the Components of the MER Formula
The simplicity is what makes the formula so powerful, but that power depends on getting the inputs right. Let’s break down what "Total Revenue" and "Total Marketing Spend" actually mean for a real-world Shopify store.
Total Revenue:
This is the easy part. It’s your top-line revenue for a given period, like a month. For most Shopify stores, this is simply the total sales figure you see right there in your analytics dashboard. A key part of understanding revenue is also knowing your numbers on a per-order basis, so it's a good idea to learn how to accurately calculate your Average Order Value (AOV).
Total Marketing Spend:
Here’s where a lot of brands trip up. Your Total Marketing Spend isn't just your ad spend on Meta or Google. To be accurate, it has to include every single cost tied to your marketing efforts.
We're talking about:
- Ad Spend: The direct cost of your ads on all platforms (Facebook, Instagram, TikTok, Google, etc.).
- Agency or Freelancer Fees: The retainers or project fees you pay your marketing partners.
- Influencer Costs: Any payments you make to creators for collabs and sponsored posts.
- Tech Subscriptions: The monthly cost of your marketing software stack (your email platform, SMS tools, analytics software—all of it).
- Creative Production: Costs for photoshoots, video creation, or graphic design work.
- Team Salaries: A portion of the salaries for your in-house marketing team.
If you forget these "hidden" costs, you'll artificially inflate your MER and get a false sense of security. The goal is to capture the true, all-in cost of generating every dollar of revenue.
Practical Examples of MER Calculation
Let's walk through a couple of examples to see how this plays out in the real world.
Example 1: The Scrappy Startup
Picture a new Shopify store that just crushed its first month. They're running lean and handling most of the marketing themselves.
- Total Monthly Revenue: $20,000
- Meta Ad Spend: $3,000
- Google Ad Spend: $1,000
- Klaviyo Subscription: $150
- Influencer Gifting: $350
- Total Spend: $4,500
Now, we just plug those numbers into the formula:
MER = $20,000 (Revenue) / $4,500 (Spend) = 4.44
This means for every $1 the startup spent on marketing, it generated $4.44 in total revenue. That’s a very healthy and efficient start.
Example 2: The Scaling Shopify Plus Brand
Next, let's look at a bigger brand using an agency with a more complex marketing setup.
- Total Monthly Revenue: $100,000
- Ad Spend (All Platforms): $15,000
- Agency Retainer: $5,000
- Influencer Payments: $3,000
- Software Stack: $1,000
- Content Creation: $1,000
- Total Spend: $25,000
Here’s how their calculation shakes out:
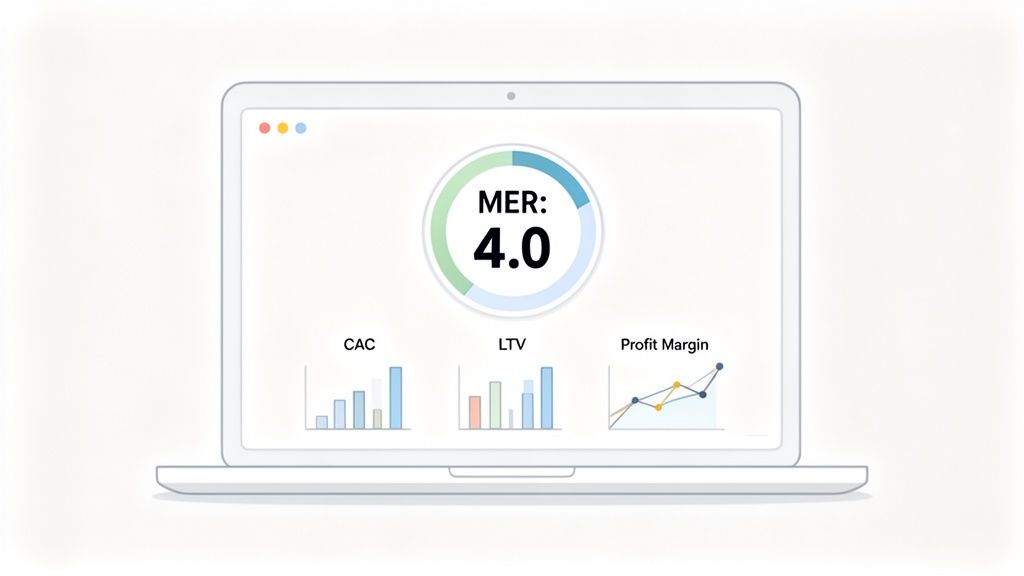
MER = $100,000 (Revenue) / $25,000 (Spend) = 4.0
Even with much higher overhead, this brand’s marketing is incredibly effective, bringing back $4 for every $1 they invest. While the ROAS might look totally different across their various channels, their overall MER of 4.0 gives them a clear, strategic benchmark for how their blended efforts are performing.
For a deeper dive into the tactical side of channel-specific metrics, check out our guide on how to calculate Return on Ad Spend.
Alright, you've crunched the numbers and have your marketing efficiency ratio staring back at you from a spreadsheet. Now what? A number in a vacuum doesn't tell you much. Is that 4.2 MER a sign of a well-oiled machine, or are you accidentally leaving money on the table?
Think of your MER as a barometer for your marketing's overall health. It shows whether you're weathering a growth storm, cruising in clear skies, or maybe just sailing a bit too cautiously. While there’s no single "magic number" that works for every single business, some general benchmarks can help you figure out where you stand and set some realistic targets.
For most established eCommerce brands, the sweet spot for a healthy MER usually lands somewhere between 3.0 and 5.0. This range is a good sign of a sustainable balance between aggressive growth and solid profitability. You're bringing in customers efficiently enough to keep expanding without burning through cash at a rate that makes your accountant sweat.
Decoding the MER Benchmarks
Let's break down what different MER levels might be telling you about your business and your current strategy. Understanding these tiers is the key to diagnosing your performance and figuring out your next move.
MER Below 3.0 (The Investment Zone):
Seeing a number below 3.0 isn't an immediate red flag, but it definitely warrants a closer look. It simply means you're spending a pretty significant chunk of your revenue on marketing. This could be a totally deliberate strategy if you're a:
- New Brand: You're in an aggressive launch phase, spending big to build brand awareness and grab that first wave of customers.
- Market Expansion: You're pushing into a new region or demographic, and that requires an upfront investment to gain any real traction.
- High LTV Product: If you're a subscription business or sell products with high repeat purchase rates, a lower initial MER is fine. You know the customer lifetime value will more than make up for it down the line.
That said, a consistently low MER could also point to some leaks in your funnel—underperforming channels, weak conversion rates, or a clunky customer journey that needs fixing.
MER Between 3.0 and 5.0 (The Growth & Profitability Zone):
This is the zone many scaling Shopify brands are aiming for. An MER in this range means your marketing engine is humming along nicely. You've likely found a solid product-market fit and have a good handle on which channels reliably bring in customers at a profit. It leaves you with enough margin to cover all your other business costs and still reinvest in growth.
Looking at historical data, this zone is where the magic happens. A 2023 analysis from Shopify pointed out that brands hitting an MER between 3 and 5 were the ones successfully balancing aggressive scaling with profitability. They moved beyond just chasing high-ROAS channels and built a more blended, sustainable strategy. You can dig deeper into these kinds of industry benchmarks on the marketing efficiency ratio to see how you stack up.
MER Above 5.0 (The Opportunity Zone):
At first glance, an MER over 5.0 looks amazing. You’re generating over $5 for every $1 you spend on ads! While this is a sign of incredible efficiency, it can also be a warning that you're being a bit too conservative with your marketing budget.
An exceptionally high MER might mean you're underinvesting in growth. You could be leaving significant market share on the table by not scaling your budget to capture more of your target audience.
If your MER is consistently this high, it might be time to get a little more aggressive. Start testing some new channels, pump more budget into your proven winners, or explore top-of-funnel campaigns to fill the pipeline for future growth.
Context Is Everything
At the end of the day, a "good" marketing efficiency ratio is completely relative. The ideal number is tied directly to the unique DNA of your business.
- Profit Margins: A brand selling high-margin luxury goods can easily thrive with a lower MER than a brand in the CPG space with razor-thin margins.
- Business Stage: A venture-backed startup with a "growth at all costs" mentality will have a wildly different MER target than a bootstrapped business focused on immediate profitability.
- Industry: Super competitive markets, like apparel, often demand more aggressive spending. This naturally leads to different benchmarks than you'd see for a niche hobbyist store.
Use these benchmarks as a starting point, not as gospel. The real insight comes from comparing your MER to your own historical performance and your specific industry's standards. That’s how you uncover the true story your numbers are trying to tell you.
Common Traps That Will Wreck Your MER Calculation
Getting a number for your Marketing Efficiency Ratio is the easy part. The real challenge? Making sure that number is actually right. A bad MER calculation is far more dangerous than having no MER at all because it gives you the confidence to make terrible, expensive decisions. It's like having a faulty GPS that sends you speeding confidently in the completely wrong direction.
To make sure your MER is a reliable guide, you need to watch out for a few common pitfalls that can completely throw off your numbers. Let's walk through how to sidestep these mistakes so your metric reflects what's really happening with your marketing.
Forgetting About the "Hidden" Marketing Costs
One of the biggest blunders is calculating MER using only the ad spend numbers you see inside your platforms like Meta or Google. This will always give you a rosy, inflated number because it conveniently ignores all the other costs that keep your marketing engine running. Your Total Marketing Spend has to be total.
That means you absolutely have to include every dollar that goes into your marketing efforts:
- Agency and Freelancer Fees: Those monthly retainers for your marketing partners are a direct cost of marketing.
- Software Subscriptions: All those tools for email, SMS, analytics, and more? They add up.
- Creative Production: Don't gloss over the budget spent on photoshoots, video production, or graphic design work.
- Team Salaries: A portion of your in-house marketing team’s paychecks needs to be in there too.
Ignoring these costs is like calculating the price of a road trip by only counting the gas. You’re missing the cost of the car, the insurance, and the maintenance, giving you a completely skewed picture of the real investment.
Analyzing MER in a Vacuum
The next critical error is staring at your marketing efficiency ratio without any context. A 4.0 MER looks fantastic on paper, but if your profit margins are razor-thin, you might still be losing money on every sale. MER tells you how efficient you are at generating revenue, not whether that revenue is actually making your business healthy.
MER is a powerful diagnostic tool, but it's not the complete health report. To get the full story, you have to look at it alongside other crucial business KPIs.
Always frame your MER with these other numbers:
- Profit Margins: After you pay for the products (COGS) and all your other operational costs, is there any profit left? A high MER with a low margin is a recipe for disaster.
- Customer Acquisition Cost (CAC): How does your overall efficiency compare to what it costs to land a single new customer?
- Lifetime Value (LTV): A lower MER might be perfectly fine if you know your customers stick around and spend a lot over time. You can afford to be less efficient upfront if the long-term payoff is huge.
Looking at these metrics together is the only way to know if your efficient marketing is actually driving sustainable, profitable growth. And that’s the name of the game.
Using Mismatched Timeframes
This one sounds simple, but it's a surprisingly common trip-up: comparing apples to oranges. If you calculate your MER using last quarter's total revenue but only this month's marketing spend, you've just created a meaningless metric. The inputs have to be from the exact same period.
Whether you're looking at your MER weekly, monthly, or quarterly, you must ensure that your Total Revenue and Total Marketing Spend figures are pulled from the identical timeframe. This consistency is the bedrock of accurate trend-spotting and allows you to make reliable decisions about where to put your money next.
Actionable Strategies to Improve Your Marketing Efficiency
Calculating your MER is the diagnosis. Now comes the treatment.
A low or stagnant MER isn't a dead end—it’s a signal to take decisive action. Improving your marketing efficiency isn't just about slashing your budget. It’s about making every single dollar you spend work harder and smarter.
Think of your marketing budget as fuel. Instead of just pouring more in, these strategies are about tuning the engine itself for maximum horsepower. By optimizing different parts of your business—from website experience to customer relationships—you can dramatically lift the revenue generated from your existing ad spend.

This is how insight turns into tangible results. It's about pulling the two levers in your MER formula: either increase total revenue or trim your spend without hurting sales. Let’s dive into the most impactful ways to do it.
Master Your Conversion Rate Optimization
One of the absolute fastest ways to boost your MER is to get more value from the traffic you already have. Pouring money into ads that send visitors to a leaky website is like trying to fill a bucket riddled with holes. Conversion Rate Optimization (CRO) is the art and science of patching those holes, turning more browsers into buyers.
Even a small uplift can have a massive impact. If you can nudge your conversion rate from 1% to 1.5%, you've just boosted your revenue by a staggering 50% from the exact same ad spend. This directly inflates the "Total Revenue" side of your MER equation, sending your efficiency score through the roof.
Start by focusing on these high-impact areas:
- Website Speed: Don't make people wait. A one-second delay in page load time can slash conversions by 7%. Get your Shopify store running lightning-fast, especially on mobile.
- Product Pages: Use high-quality images, write compelling descriptions that sell the benefit, and plaster social proof like reviews everywhere. Build trust and desire.
- Checkout Process: Reduce friction at all costs. Kill unnecessary form fields, offer guest checkout, and provide multiple payment options to cut down on cart abandonment.
Double Down on Customer Retention
Here’s a hard truth: acquiring a new customer is up to five times more expensive than keeping an existing one. A powerful, yet often neglected, strategy for improving MER is to obsess over retention.
By increasing the Lifetime Value (LTV) of your customers, you boost your total revenue over the long haul without a proportional increase in acquisition costs. This is a surefire way to supercharge your MER, making that initial marketing investment pay dividends again and again.
By focusing on your existing customer base, you’re not just making sales; you’re building an asset. Loyal customers become your most profitable segment and your best marketers through word-of-mouth.
Get your customers to come back for more with these tactics:
- Email & SMS Marketing: Use post-purchase flows to build a relationship, cross-sell relevant products, and announce new arrivals to your most engaged audience.
- Loyalty Programs: Reward repeat business. Give customers points, exclusive access, or special discounts to incentivize their next purchase.
- Exceptional Customer Service: Create a memorable, positive experience that turns one-time buyers into lifelong advocates for your brand.
Strategically Reallocate Your Budget
Not all marketing channels are created equal. A classic mistake that tanks MER is spreading your budget too thin or funding underperforming channels out of sheer habit. Improving your marketing efficiency demands a ruthless, data-driven approach to budget allocation.
Dig into your analytics. Find out which channels are your true growth engines and which are just expensive hobbies. This isn't about cutting your budget; it's about shifting it from low-impact activities to high-impact ones. This optimizes the "Total Marketing Spend" side of the MER formula by making every dollar count.
Imagine you're spending $5,000 a month on a channel that's barely breaking even, while your star performer is starved for more budget. Shifting that spend to your proven winner could unlock a huge amount of new revenue for the same total cost, instantly improving your MER.
To guide this process, ask these critical questions:
- Which channels deliver the highest LTV customers? Focus on acquiring customers who spend more over time, not just the ones with the cheapest clicks.
- Where is there untapped potential? Is there a channel showing promising early signs that could explode with more investment?
- Are we seeing the whole picture? Use a more advanced attribution model to understand how channels work together. You don't want to cut a top-of-funnel channel that assists a ton of final conversions.
Combining CRO, retention, and smart budget reallocation creates a powerful system for continuous improvement. This approach ensures you're not just measuring your MER, but actively and intelligently managing it for sustainable, profitable growth.
MER Improvement Action Plan
To bring it all together, here is a simple action plan that connects each strategy to its primary impact and provides a concrete tactic you can implement today.
This table serves as a quick-start guide. Focus on one area, execute the tactic, measure the change in your MER, and repeat. Consistent, small improvements across these areas will compound over time, transforming your marketing from a cost center into a powerful growth engine.
Integrating MER into Your Business Reporting
Figuring out your Marketing Efficiency Ratio is a solid start, but its real magic happens when you pull it out of a lonely spreadsheet and stitch it into the fabric of your business reporting. MER shouldn't just be some metric the marketing team obsesses over; it needs to be a core Key Performance Indicator (KPI) that shapes high-level strategy and financial planning.
Think of it like this: MER is your car's speedometer. It tells you how fast you’re going, which is great. But to actually get to your destination safely and efficiently, you also need to keep an eye on the fuel gauge (profit margins), the engine temperature (Customer Acquisition Cost), and the GPS (Lifetime Value). Looking at all of them together gives you the full story of your journey.
This holistic view is crucial. It ensures a strong MER is actually driving profitable growth, not just vanity revenue that hides deeper problems under the surface.
Building Your Holistic Performance Dashboard
The key is to create a simple, powerful dashboard that puts marketing performance on the same page as C-suite financial goals. This isn't just about tracking numbers; it's about giving those numbers context by placing MER right alongside other vital signs of your business's health.
Your dashboard should answer the big questions at a glance:
- Profitability Check: Is our MER actually high enough to keep us profitable after we factor in COGS and all our other operational costs?
- Acquisition Efficiency: How does our blended MER stack up against our channel-specific Customer Acquisition Cost (CAC)?
- Long-Term Value: Are we bringing in customers efficiently (good MER) who will also stick around and spend more over time (high LTV)?
When you visualize these relationships, you graduate from basic marketing reports to true business intelligence. If you're looking for a good starting point for structuring this data, our guide to mastering the Shopify analytics dashboard offers a fantastic framework.
A dashboard that marries MER with financial KPIs is the bridge between the marketing team and the boardroom. It translates clicks and conversions into the language of profitability, making it far easier to justify budgets and strategic decisions.
This integrated approach gets everyone, from the ad buyer to the CEO, to understand exactly how marketing efficiency hits the bottom line.
Connecting MER to Broader Business Goals
At the end of the day, weaving the Marketing Efficiency Ratio into your reporting is all about making smarter, more profitable decisions across the board. It's about seeing the bigger picture.
For instance, when you track MER next to a metric like inventory velocity, you can suddenly get strategic. You can build marketing campaigns that not only drive revenue but also help clear out that stagnant stock that's been sitting in the warehouse for months.
This kind of alignment makes sure your marketing efforts are always pulling in the same direction as the company's most critical objectives. It elevates MER from a simple formula to a powerful tool for driving sustainable, long-term growth.
Frequently Asked Questions About MER
Even when you've got the basics down, a few tricky questions about MER always seem to pop up. Let's tackle the most common ones we hear from eCommerce owners so you can put this metric to work with total confidence.
How Often Should I Review My MER?
For most brands, a monthly check-in is the sweet spot. This gives you enough data to spot real trends without getting lost in daily noise, but it’s still frequent enough to catch problems before they spiral.
That said, during high-stakes moments like a product launch or the BFCM rush, you’ll want to switch to a weekly review. When every dollar counts, you need to be able to make quick adjustments to your ad spend on the fly.
Can I Have a Good ROAS but a Bad MER?
You absolutely can, and this is exactly the kind of dangerous blind spot MER is designed to expose. We see this all the time. A brand might have one channel—say, branded search on Google—that pulls in an incredible ROAS, making the overall numbers look great at a glance.
But lurking beneath the surface, other channels are burning through cash. Maybe it’s an expensive top-of-funnel awareness campaign or some experimental social ads that just aren't converting.
A sky-high ROAS on one or two channels can easily hide widespread inefficiency across your entire marketing budget. MER strips away that illusion, giving you a blended, honest look at your total performance. It’s the true health report for your marketing engine.
This is precisely why leaning only on ROAS for major budget decisions can lead you astray.
Does MER Work for Businesses with Long Sales Cycles?
Yes, it just requires a small tweak in your thinking. If your customers take several months to go from their first visit to making a purchase, a simple monthly MER can be misleading. A big marketing push in January might not show up as revenue until March.
For these kinds of businesses, it’s far more insightful to look at your marketing efficiency ratio over a longer period, like quarterly or even semi-annually. This lines up your spending with the revenue it actually generates. Some brands also track a leading indicator like "Pipeline MER" (which is just Total Pipeline Value / Total Marketing Spend) to get an early read on efficiency before the money officially hits the bank.
Ready to boost your MER with a faster, higher-converting Shopify store? The experts at ECORN specialize in Shopify development and CRO to turn more of your traffic into revenue. Get in touch to see how we can help you scale efficiently.


Agentic AI for Ecommerce: Boost Your Sales in 2026
Mastering Email Marketing Data for eCommerce Growth
Conversion Rate Optimisation Australia: Boost Your Sales
Conversion Rate Optimization AI: Your Shopify Store Guide

10 Product Bundling Strategies for Shopify in 2026

How to Increase Customer Lifetime Value: A Shopify Playbook

AI Customer Service Automation: Shopify Guide 2026

Clean Website Design: A Shopify Conversion Playbook

Omnichannel Retail Strategy: A Shopify Playbook
Product Data Enrichment: A Guide for Shopify Brands

Instagram Shopping Features a Guide for Shopify Stores
What Is Revenue Optimization: A Holistic RevOps Guide

Benefits of Conversion Rate Optimization: Boost Your

WordPress to Shopify Migration: Your 2026 Seamless Switch

Boost Sales: Ecommerce Payment Processing Guide 2026

Unified Commerce Platform: Benefits, KPIs & Shopify Guide

How to Reduce Bounce Rate eCommerce: Your 2026 Guide
Shopify API Integration: A Practical End-to-End Guide

How to Implement Data Governance: A 2026 Guide

Shopify Store Development Cost: A 2026 Breakdown
What Is Server Side Tracking: The Shopify Guide 2026
Marketing Automation Workflows: A Shopify Guide for 2026

Shopify: How to Reduce Technical Debt

Shopify UX Design Change: A Playbook for Growth

User Generated Content Strategy: Shopify Playbook

Shopify Pause and Build Plan Cost: A Complete 2026 Guide

Compare at Price on Shopify: A Complete Guide for 2026

Where Can I Sell My Prints? 10 Best Platforms for 2026

Shopify Order Management System: The Ultimate Guide 2026
What Is Marketing Attribution? an eCommerce Guide for 2026

10 Best Black Friday Sales Sheets for 2026

Discover the Top Social Media Marketing Agencies For
Consumer Confidence Definition for eCommerce in 2026

What Is Social Commerce? Your 2026 Guide to Boosting Sales

A Social Ad Campaign Playbook for eCommerce Growth

7 Best FAQ Page Examples for SaaS & eCommerce

Market Research in Fashion Industry: A Guide for Shopify

Shopify Migration Services: Expert Guide for 2026

Mastering FB Retargeting Ads for Shopify in 2026
What Is Omnichannel Ecommerce

Master Your Shopify Plus Migration: The 2026 Guide
Shopify Integration Services: A Merchant's 2026 Guide

Shopify Collection Description: A Guide to SEO & Sales

Shopify Plus Contact: Reach Sales & Support Effectively

Top Luxury Shopify Stores: Design & UX Strategies

How to Improve Customer Experience: A Shopify Roadmap

Creative Facebook Ads: 10 Examples for Shopify Brands

Remarketing with Facebook Ads: A Shopify Guide for 2026

SEO Linking Strategies for Shopify Stores
Top 7 Statistics YouTube Channels for eCommerce in 2026

Hiring Shopify Plus Designers: A Founder's Guide

Shopify Product Variation: Master Your Variants for 2026

Leverage Ai Solutions Brands: Your 2026 Shopify Growth Guide

Filters in Shopify: A Guide for Growing Brands

Shopify Plus Developer: A Guide for Growing Brands

When Does Black Friday Online Start? A 2026 Guide
Black Friday Email Marketing: Shopify & Klaviyo Guide

Polaris Design System: The Complete Shopify Guide

How to Hire a Consultant Email Marketing Expert

What Is Q4? A Shopify Merchant's Guide to Peak Season

Marketing Organization Structure for eCommerce Growth

Top Account-Based Marketing Agency Guide for 2026

7 Remarketing Ad Examples for Your 2026 Campaigns

AI Retail Solutions: Boost Your Shopify Store

Migrate to Shopify: The Definitive 2026 Guide

Shopify Authentication App: A Guide for Secure Stores
Why Strategic Marketing Is Important for Growth in 2026

How to Create a Size Chart in Shopify: 2026 Guide

Shopify Themes for Jewelry: The Definitive 2026 Guide

Minimal Shopify Templates: Faster, Higher-Converting Stores

Maximize Profit: Shopify CC Fees 2026 Guide

Best Shopify Apps for Beginners in 2026

How to Improve Online Shopping Experience in 2026

Shopify Design and Development Services: A 2026 Guide

Small Business Social Media Marketing Agency: A Hiring Guide

Bulk Edit Shopify: A Guide to Save Hours on Store Updates

2026 Trends in Food and Beverage Industry

Post Purchase Survey Guide for Shopify Stores

How to Build an Ecommerce Brand in 2026

Conversion Rate Optimization for Ecommerce: Maximize Profit
How to Use Customer Data to Increase Sales: A Guide

Shopify for Enterprise: The 2026 Deep Dive Guide

Email Marketing Agencies: The Guide for Shopify Brands

Boost Sales With The Right Shipping Shopify App

Your Guide to the Shopify Site Map

7 Headless Commerce Examples for 2026

Mastering Trends in Cosmetic Industry for 2026

Transfer Shopify to BigCommerce The Complete 2026 Playbook

What Is Shopify Collective? Your 2026 Guide to Success

Unlock Shopify Growth with Site Link SEO

Integrating Shopify and WordPress A Complete Guide for 2026

Naming a Clothing Store: A Shopify Founder's Playbook

Guide to buying shopify store in 2026

Buying shopify store: Buying a Shopify Store: Invest Wisely

Food & Beverage Marketing: A Complete Guide for 2026

Facebook Ads Agency: A Shopify Brand's Hiring Guide

Shopify Apparel Stores: A 2026 Launch & Scale Guide

How to Deactivate Shopify Store: The 2026 Guide

Shopify and Square: The 2026 Ultimate Comparison

Your Guide to Beauty Products Ecommerce


newsletter in your inbox