

Every Shopify founder knows the feeling. Ad spend goes up, the dashboard gets louder, and the first question is always the same, how much can I afford to spend to get a customer? That's the wrong question to ask alone. The better question is what that customer is worth after the first checkout, after the second order, and after the brand earns a place in their routine.
That long view is customer lifetime value, usually shortened to CLV. In plain English, it's the total revenue or profit a customer brings in over the full relationship with your store, not just the first order. IBM frames it as customer value multiplied by average customer lifespan, while Salesforce uses a version that subtracts the costs to serve the customer, which makes the point even clearer, CLV is a profitability lens, not just a spend metric. For a growing Shopify brand, that changes everything from acquisition budgets to which products deserve the homepage.
What Customer Lifetime Value Actually Means for Your Store
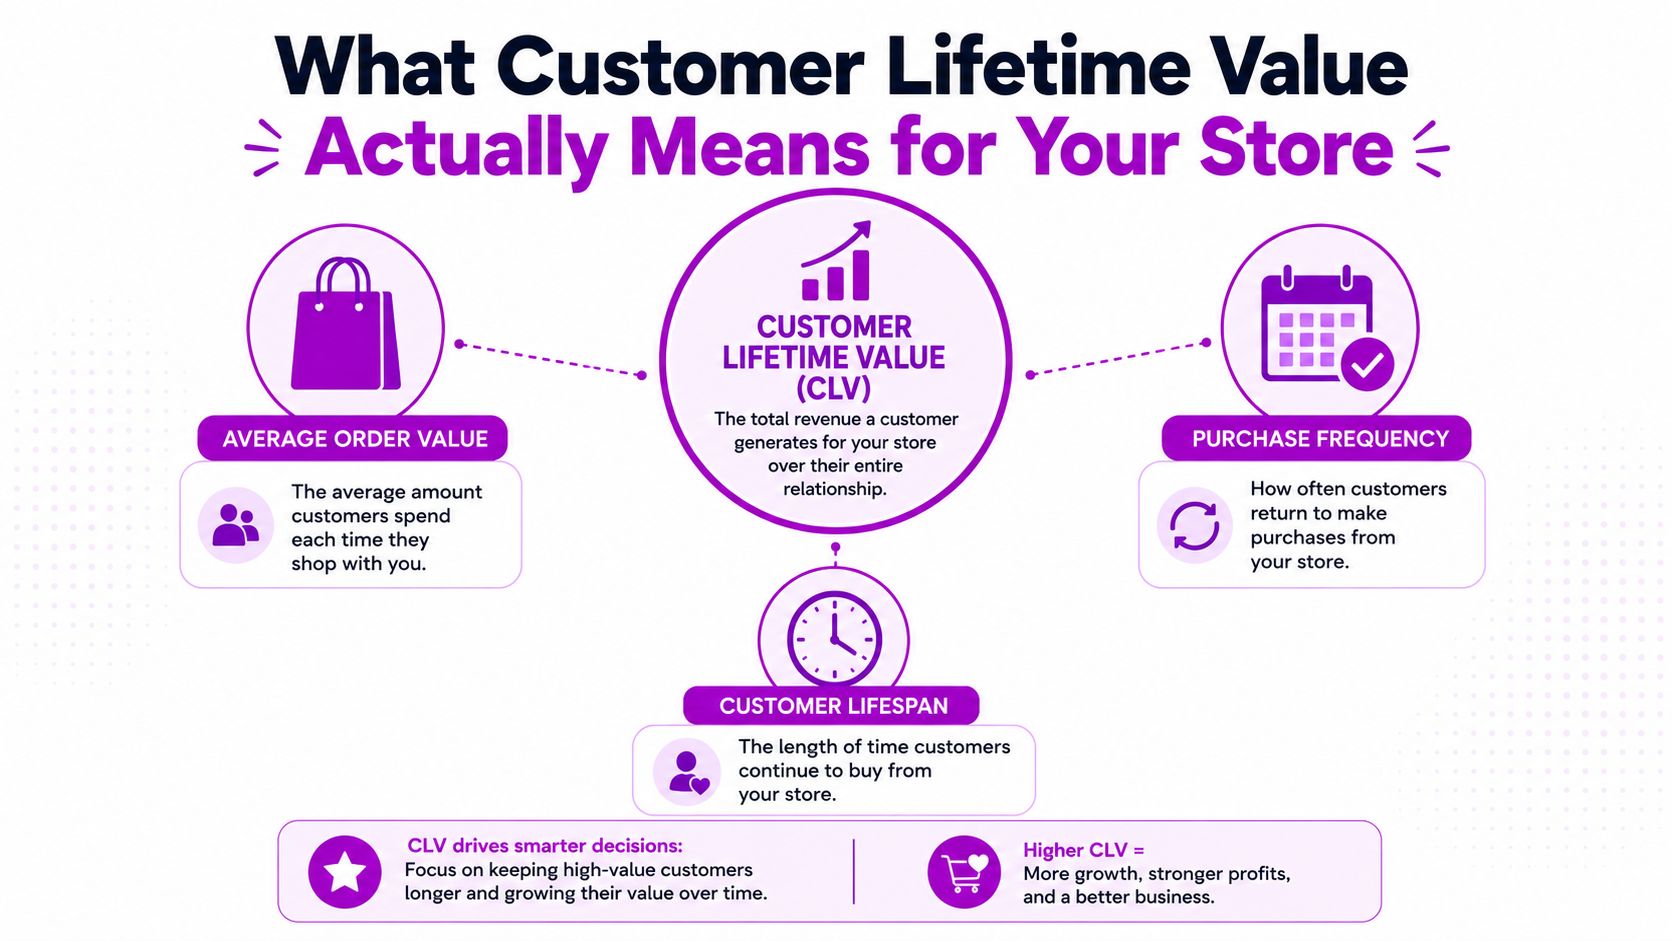
The easiest way to think about what is customer lifetime value is to stop thinking about the transaction and start thinking about the relationship. A first order can be profitable, but it can also be a loss leader, a trial, or a toe in the water. CLV asks what happens after that first purchase, because that's where many stores make or lose their margin.
A customer who buys once and disappears is a different asset from one who comes back every few weeks, adds more items over time, and needs less convincing each visit. That's why CLV is more than a finance term. It tells you how much room you have to pay for traffic, how aggressive you can be with offers, and whether your store is built for one-time wins or repeat buying.
Why CLV changes the way you judge a store
The basic logic behind CLV is consistent across major references, and it always comes back to three drivers in ecommerce and subscription businesses, average order value, purchase frequency, and customer lifespan. IBM, NetSuite, and Twilio all describe CLV in ways that connect those drivers to forecasting and long-term planning, which is why CLV works so well as an operating metric instead of a vanity report. When you know what each customer tends to buy, how often they return, and how long they stay active, you can make better decisions before the month closes.
Practical rule: if you're optimizing only for the first order, you're probably underinvesting in the part of the customer journey that actually pays you back.
That's the central shift. A homepage slot, an upsell, a subscription offer, or a post-purchase flow all matter because they can move one of those three drivers. CLV gives you a way to ask a simple question about every growth move, does this increase what each customer is worth over time?
The Basic CLV Formula You Can Calculate Today
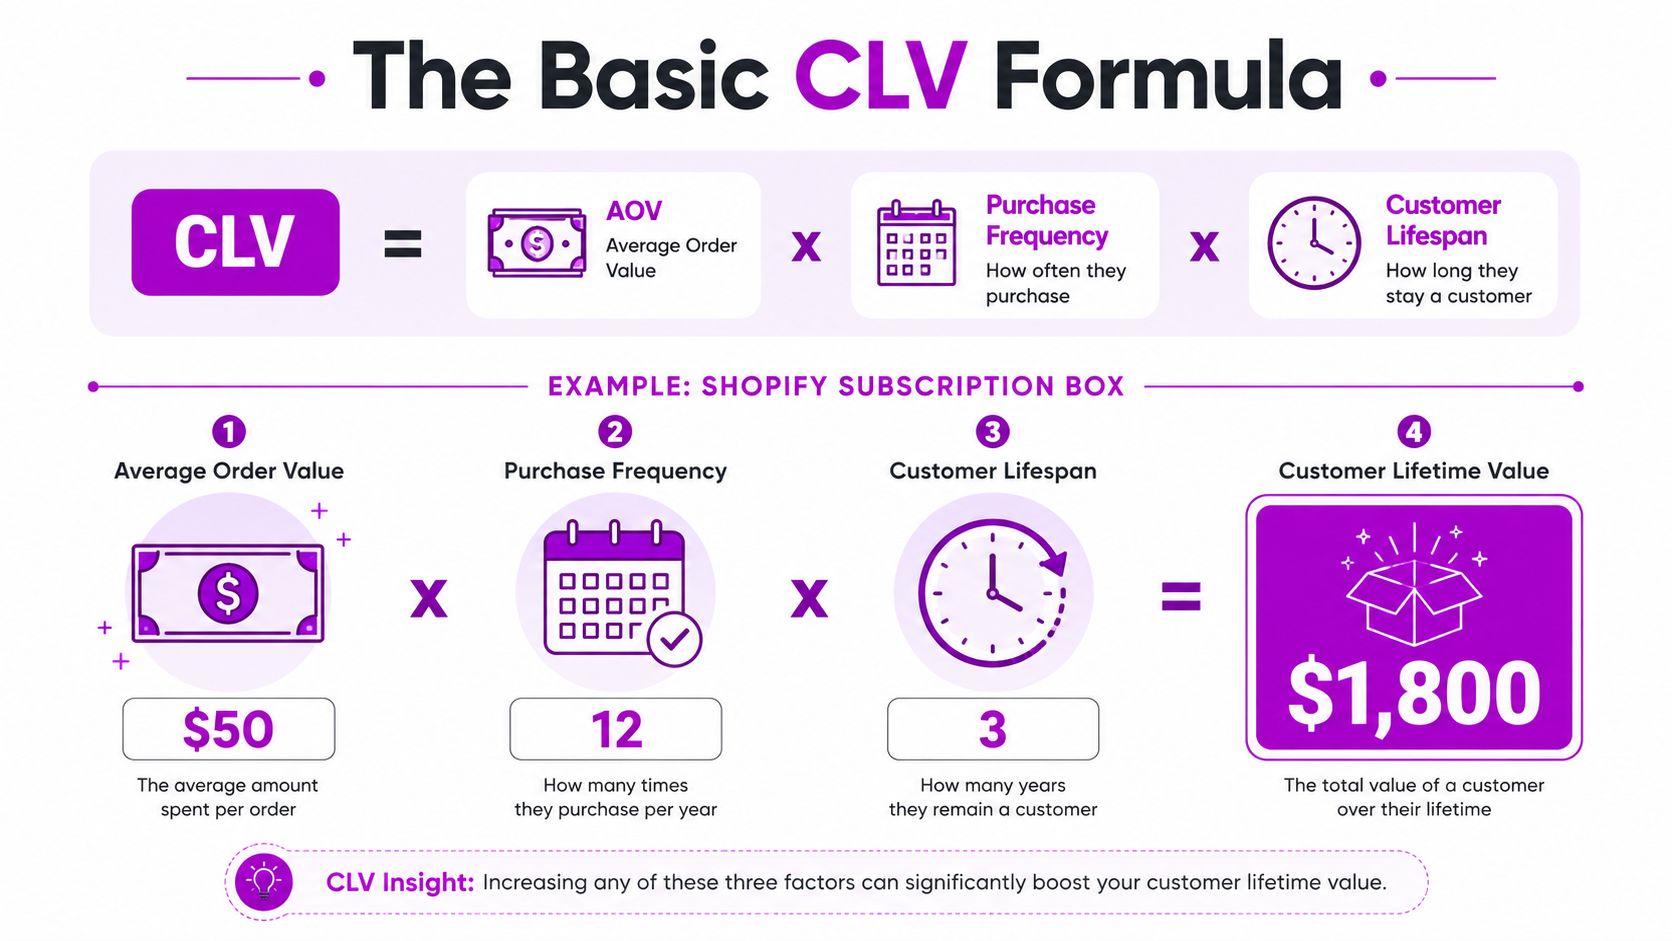
The simplest useful version of CLV is built from the same three building blocks you already see in Shopify reports. Start with average order value, multiply by purchase frequency, then multiply by customer lifespan. That's enough to get a baseline you can use this week.
The formula is easy to run through with a subscription example. Say your store sells a recurring box with an average order value of $50, customers buy 12 times a year, and the average customer stays for 3 years. The math is straightforward, $50 × 12 × 3 = $1,800. That gives you a first-pass CLV of $1,800 before you factor in costs.
How to build a baseline from Shopify data
You don't need a finance team to get started. Export orders from Shopify, calculate average order value from completed purchases, estimate purchase frequency from repeat orders over a chosen time window, and use your repeat customer behavior to approximate lifespan. If you're working from a clean cohort view, the number gets much more useful because it reflects actual buying patterns instead of a blended store average.
A simple spreadsheet is enough for a baseline, but don't stop there if your store has meaningful returns, support load, or heavy fulfillment costs. Salesforce's more practical formula, CLV = (Average Revenue Per Customer × Customer Lifespan) − Total Costs to Serve, is a reminder that gross revenue isn't the same thing as value. If shipping, support, or returns eat into profit, your real CLV is lower than the quick formula suggests.
Where this shortcut is enough
For a young Shopify brand, the simple formula is often the right place to begin. It's fast, easy to explain, and good enough to compare products, customer groups, or channels. Once the store has enough repeat data and meaningful operational costs, you can move to a more rigorous model without losing the intuition you built here.
The Discounted Cash Flow Version of CLV
The more rigorous CLV model treats the number as a discounted cash-flow estimate, which means future profit is worth slightly less than profit in hand today. In its fuller form, CLV is the present value of future margin from a customer relationship, often modeled as the sum of future revenue multiplied by gross margin and discounted over time, then reduced by acquisition cost. That matters because a customer who buys a lot on paper can still be a weak economic asset if margins are thin or servicing costs are high.
The logic is simple. Gross margin tells you what's left after direct product costs. Discount rate reflects the fact that money later is less valuable than money now. Time horizon keeps you from pretending every customer stays forever.
Why two customers can look the same and still be worth very different amounts
Use the same spend profile and the same total revenue, and CLV can still split apart quickly once margin and servicing are included. One customer may return everything, which destroys value even if the top-line spend looks healthy. Another may keep most orders and create much more real profit, even if the order history appears similar at first glance.
That's why the academic and practitioner conversation around CLV keeps coming back to present value and costs, not just revenue. The UCLA Anderson reference points out a common problem, many explainers simplify CLV too far and ignore margin, discounting, or servicing costs, which makes the number look better than it really is. If you sell products with variable shipping, high return rates, or lots of support tickets, that gap matters fast.
A customer can be high revenue and low value at the same time.
When to move beyond the basic formula
Most Shopify brands don't need a fully modeled discounted cash-flow formula on day one. You do need it when acquisition spend is rising, order economics are uneven, or customer behavior differs a lot by segment. At that point, CLV becomes a decision variable for bidding, retention investment, and channel prioritization, not just a reporting figure.
LTV to CAC and Retention Rate Explained Together
CLV gets useful when it sits next to CAC, the cost to acquire a customer. The widely cited ecommerce benchmark is a 3:1 CLV:CAC ratio, which means the business is aiming to generate about $3 in lifetime value for every $1 spent acquiring a customer. That benchmark shows up in both ecommerce and SaaS-style guidance because it gives operators a fast read on whether growth is healthy or reckless. Ringly.io's ecommerce CLV benchmark guide is one of the clearest references for those ranges.
Retention rate is the other half of that story. A store can spend aggressively on acquisition and still look healthy if customers come back often enough to support the upfront cost. If they don't, you end up buying first orders that never repay themselves.
| Business Model | Typical CLV Range | Healthy LTV:CAC |
|---|---|---|
| Ecommerce | $100 to $300 | 3:1 |
| Subscription | $400 to $800 | 3:1 |
| Beauty subscription | $480 to $720 | 3:1 |
| Supplements | $680 to $920 | 3:1 |
What the ratio feels like in practice
If your ratio is too low, you'll feel it in campaign performance. Paid channels look busy, but contribution margin stays tight and every scaling decision feels risky. If the ratio is too high, you may be underinvesting in growth and leaving profitable demand on the table.
The goal isn't to chase the biggest ratio possible. The goal is to buy customers at a price that still leaves room for product, support, fulfillment, and profit. That's why CLV and CAC need to be reviewed together, not in separate dashboards.
Strategies That Actually Move CLV in a Shopify Store
CLV moves when one of its three drivers moves. If you want a useful playbook, group the work by average order value, purchase frequency, and customer lifespan, then attach each tactic to the driver it changes. That keeps the conversation grounded in economics instead of generic growth advice.
Raise average order value without distorting demand
Product page CRO is the cleanest lever here. Better product photography, stronger bundles, and clearer size or usage guidance can lift basket size because shoppers understand what they need before they reach checkout. On Shopify, that often looks like a bundle block, a quantity break, or a smarter cross-sell that fits the cart instead of distracting from it.
Checkout is part of this too. If you make add-ons visible at the right point, you can increase order value without forcing the customer into a second decision later. The key is to make the add-on feel like a natural part of the purchase, not a separate pitch.
Increase purchase frequency through relevance
Personalization is what keeps frequency from flattening out. A skincare store can recommend replenishment products based on purchase history. A coffee brand can use subscription prompts for the products people already buy every month. A supplement brand can trigger reorder reminders before the customer runs out.
If you're also trying to lower acquisition pressure, it helps to compare CLV work with strategies to reduce acquisition costs, because the cheapest customer to acquire is often the one who comes back on their own. The point isn't to cut spend everywhere. It's to make each acquired customer worth more through repeat behavior.
Extend customer lifespan with retention systems
Subscriptions are the most obvious lifespan lever, but they're not the only one. Loyalty programs, replenishment emails, and win-back flows all help customers stay active longer. A post-purchase education sequence can also keep a new buyer from going quiet by showing them how to use the product well enough to reorder.
ECORN's guide on increasing customer lifetime value is a practical reference if you want to connect retention audits, segmentation, and dashboarding into one Shopify workflow. That kind of structure matters because CLV doesn't improve just by hoping customers return. It improves when your store gives them a reason to.
Measuring and Tracking CLV in Shopify Analytics
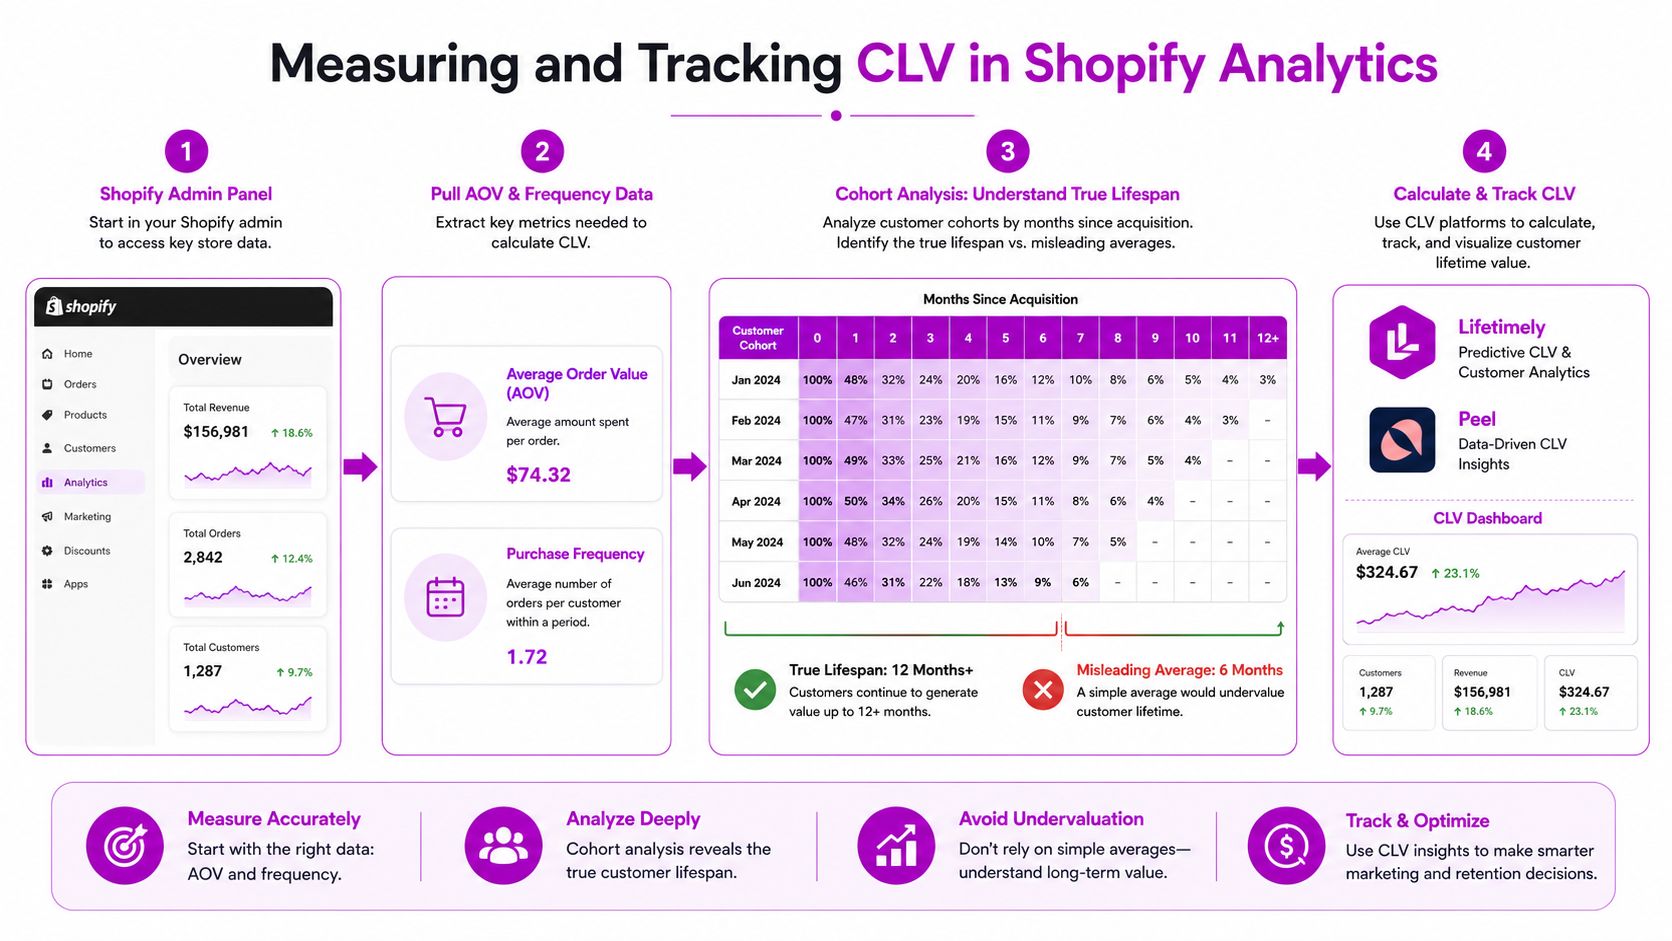
The most common CLV mistake is treating one blended average as if every customer behaves the same. They don't. Paid social buyers, email subscribers, wholesale-style repeat buyers, and organic shoppers can all produce very different lifetime patterns inside the same store, which is why cohort analysis matters so much.
Start in Shopify analytics with the basics. Pull average order value, repeat purchase behavior, and customer groups from your order history. Then look at cohorts, not just averages, so you can see how customers acquired in a given month behave over time. Cohort views are where you notice the difference between a true lifespan and a misleading average.
What good CLV reporting actually looks like
Tools like Lifetimely, Peel, and Triple Whale surface CLV at the segment level, which is where the useful decisions live. You want to see whether one acquisition channel produces higher repeat rates, whether email-acquired customers spend more over time, and whether a particular product category pulls in buyers who stick around longer. Segment-level reporting is what turns CLV from a broad statistic into an operating input.
Track segments, not just the store average. Averages hide the channel mix that drives profit.
If you need a stronger dashboarding foundation, ECORN's Shopify analytics dashboard guide is a useful companion for building the right reporting layer around those inputs. The tools are only useful if the data is organized around decisions.
Why predictive CLV is becoming the default
Static formulas are still useful, but predictive CLV is where many platforms are headed. As unified data gets cleaner, AI-driven forecasting can estimate future value from actual behavior instead of waiting for a full lifecycle to play out. That matters when you need to decide what to bid, which segment to nurture, and where to spend next week's budget.
Your CLV Implementation Checklist and Common Mistakes
A useful CLV program doesn't need a massive overhaul. It needs a clean formula, a clear segment view, and a regular review cadence. Use this checklist to get the basics working this week.
- Define your formula. Decide whether you're tracking revenue, gross profit, or net profit so the team isn't arguing over different numbers.
- Pick a tool. Choose one reporting layer for CLV, whether that's Shopify analytics plus a spreadsheet or a platform that surfaces cohort and segment views.
- Set up cohorts. Separate customers by acquisition month or channel so you can see lifespan instead of hiding behind a blended average.
- Build a retention dashboard. Put repeat purchase behavior, AOV, and lifespan in one view so the team can read the number quickly.
- Review CLV to CAC monthly. Compare acquisition cost against lifetime value often enough to catch drift before scaling gets expensive.
The mistakes that quietly break CLV analysis
The first mistake is measuring revenue only and calling it value. That hides margin, shipping, and support costs, which can make a weak customer look strong. The second is using a blended average that masks channel-level differences. The third is ignoring repeat-purchase rate, which is often the earliest signal that CLV is about to rise or fall.
The next shift is already visible in better ecommerce stacks. As more brands connect unified commerce data with AI-driven forecasting, CLV is moving from a quarterly report to a real-time decisioning signal. That's where Shopify operators will gain a strategic advantage, because the number stops describing the business and starts steering it.
If you want help turning CLV into a working dashboard, retention plan, and acquisition guardrail for your Shopify store, ECORN builds Shopify design, development, and CRO work that connects those pieces into one operating system. Visit their team if you want a practical setup that links CLV to the decisions you make on Monday, not just the reports you read on Friday.


Shopify Plus Ecommerce Agency: How to Pick the Right One
Shopify Themes Retina: How to Serve 2x Images

How to Cross Sell on Shopify Without Friction
Best Shopify Theme for Custom Products Compared
Multi Store Inventory Management: A Practical Guide

SEO Consulting for Ecommerce: A Practical Guide
Shopify Theme Updater App: A Safe Update Playbook

Shopify Git Integration: A Developer's Guide to 2026
Headless Ecommerce Development Services Explained

How to Build a Shopify Clothing Website That Converts
How to Launch a Box Subscription Business in 2026

Luxury Skincare Branding Playbook That Converters
10 Best Podcast Ecommerce Shows for Store Growth in 2026
Shopify Developer Hourly Rate: What to Pay in 2026
Critical Shopify Setup Errors That Are Secretly Sabotaging Your Store
Ecommerce Conversion Tracking: The Complete How-To Guide
Shopify Design Agency: How to Pick the Right Partner
Mastering Multi Store Management on Shopify
Scale Shopify Store
10 Shopify App Ideas Worth Building in 2026
Conversion Rate Optimization for Landing Pages: The Playbook
Shopify Plus Automation: A Guide for 2026
10 Social Selling Platforms for Shopify Merchants
Shopify Website Design Examples: 7 Stores Worth Studying
7 Ecommerce Newsletter Examples for Shopify Brands
One Product Shopify Store: Build and Scale
Mobile Pop Up Strategy for Shopify Stores That Converts
Sitemap for Shopify: How to Find, Optimize, and Submit It
7 Single Product Websites Worth Emulating
Product Variants Shopify: The Complete 2026 Guide
Ecommerce Analytics Consulting for Growth
What Is AI Integration for eCommerce
How to Choose the Right eCommerce Website Development Firm
E Business Strategy Implementation
Conversion Tracking Setup for Shopify Stores
BigCommerce vs Shopify Plus Which Enterprise Wins in 2026
Shopify Theme Kit: Setup, Commands, and Migration Guide

Shopify Extension Development: A Practical 2026 Guide
Shopify Speed Score Explained and How to Improve It
Shopify Mobile Optimization: The 2026 Playbook
How to Add Subcategory in Shopify for Better UX
How to Implement Structured Data for Ecommerce in 2026
SEO App Mobile: Shopify Store Optimization Guide
Shopify Plus Support: What It Includes and How to Choose
Google Ads for Shopify: The Complete 2026 Playbook
Shopify New York: How to Find and Hire the Right Agency
Google Search Console for Shopify: The Complete Setup
First Party Data Collection for eCommerce Growth
FAQ Online Store Guide: Build and Measure It Right
Do FB Ads Work for eCommerce in 2026?
One Page Checkout for Shopify: Design and Implementation
Shopify GraphQL vs REST: The 2026 Developer Decision
Shopify Ecommerce Consulting: Strategy, Pricing &
Are Reddit Ads Worth It for eCommerce Brands
Shopify Title and Meta Description: A Practical 2026 Guide
Product Video Best Practices for Shopify Brands
Real-Time Inventory Management: A 2026 Guide
AI Chatbot Integration for Shopify Stores
Affiliate Program Management: A Shopify Guide
10 Best Performance Monitoring Tools for Shopify in 2026
Digital Asset Management for eCommerce Brands in 2026
Every Type of Facebook Ads Explained for eCommerce Growth
Product Information Management Explained for Shopify Brands
Support Ticket System: A Guide for Shopify Stores

10 Best Customer Service Tools for Shopify in 2026

Can I Start a Business with No Money? a 2026 Blueprint

What Sells Good on Etsy: Best Niches for 2026

Shopify Add to Cart Button: A Practical 2026 Guide

Customer Feedback Automation: A Practical eCommerce Guide
Critical Rendering Path: A Guide for Shopify Stores

How to Promote on TikTok for eCommerce in 2026

B2B eCommerce Consulting That Drives Real Revenue
10 Best Practices for Site Navigation in 2026
Return vs Refund for Shopify Stores: A Practical Guide
What Is Voice of Customer Research for eCommerce

SMS Marketing for Ecommerce That Actually Converts

Master How to Improve Email Deliverability in 2026

Top 8 eCommerce Partners NYC for Shopify Brands in 2026
Machine Learning for Ecommerce: Boost Your Shopify Store

Beauty Market Research: Your 2026 Growth Guide

Shopify International Expansion: A 2026 Roadmap
What Does CRO Stand for in Business: Understanding CRO

Shopify Visual Merchandising: A Playbook for Higher Sales

Shopify Landing Page Design: Master Conversion in 2026
10 Best AI SEO Optimization Tools for Shopify in 2026

Agentic AI for Ecommerce: Boost Your Sales in 2026
Mastering Email Marketing Data for eCommerce Growth

Conversion Rate Optimisation Australia: Boost Your Sales
Conversion Rate Optimization AI: Your Shopify Store Guide

10 Product Bundling Strategies for Shopify in 2026
How to Increase Customer Lifetime Value: A Shopify Playbook
AI Customer Service Automation: Shopify Guide 2026
Clean Website Design: A Shopify Conversion Playbook

Omnichannel Retail Strategy: A Shopify Playbook
Product Data Enrichment: A Guide for Shopify Brands
Instagram Shopping Features a Guide for Shopify Stores
What Is Revenue Optimization: A Holistic RevOps Guide

Benefits of Conversion Rate Optimization: Boost Your
WordPress to Shopify Migration: Your 2026 Seamless Switch
Boost Sales: Ecommerce Payment Processing Guide 2026


newsletter in your inbox