

Your Meta ads are bringing qualified shoppers to a Shopify store, but the product page loses them before they add anything to the cart. The team responds by changing the hero image, rewriting the button, and adding another pop-up. A week later, the store has more design opinions, but no reliable answer about where revenue is leaking.
That's the problem with treating CRO as a collection of page tweaks. Conversion rate optimization is a measurement and experimentation discipline for the entire customer journey, from the first landing page visit through checkout, purchase recovery, and repeat buying. The core calculation is simple, conversions divided by visitors or sessions, multiplied by 100, but useful optimization depends on context, segmentation, and disciplined learning.
What Conversion Rate Optimization Really Means for Shopify
A Shopify store has several conversion surfaces, not one. The product detail page must explain value, remove uncertainty, and make the purchase action obvious. Collection pages help shoppers compare products. The cart drawer confirms price, shipping, and momentum. Checkout carries the highest purchase intent, while post-purchase experiences and email or SMS recovery flows influence revenue after the first session.
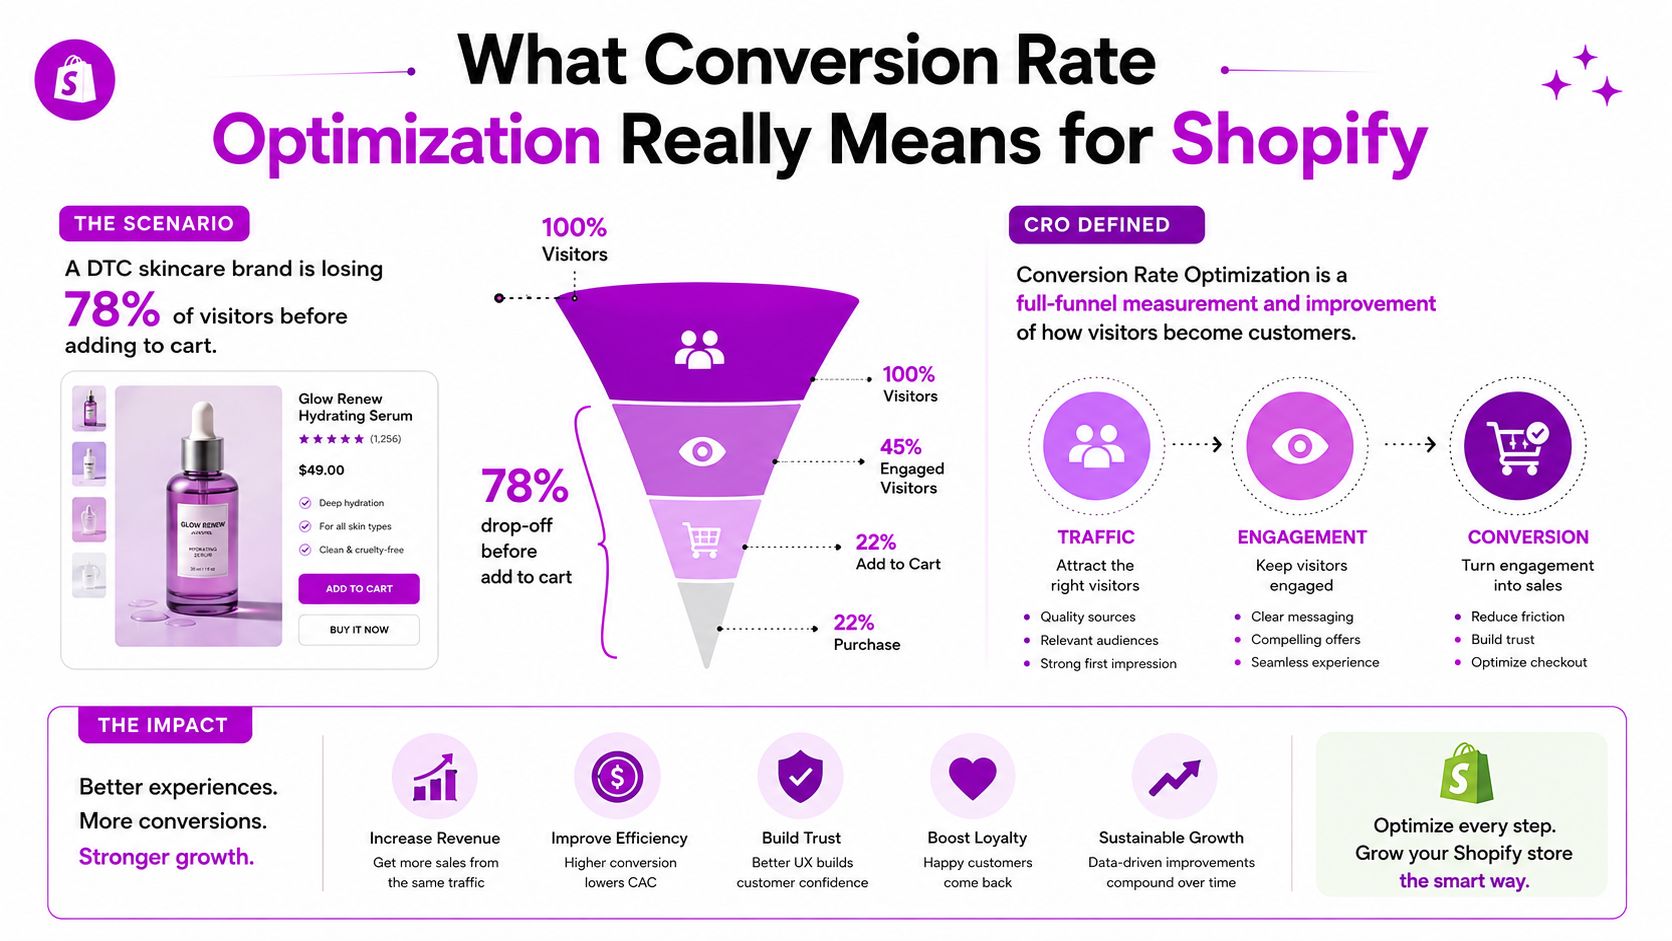
A useful CRO program connects those stages instead of optimizing them in isolation. A visitor may arrive from a paid social ad, browse on a phone, return later on a laptop, add a product to the cart, and purchase after receiving a reminder. Treating that journey as a single landing-page session hides important friction. Contentsquare's conversion guidance also emphasizes visit value, retention, returning visitors, and cross-device behavior alongside the headline conversion rate.
The difference between activity and a program
One operator might launch a random hero-banner test because the homepage feels stale. Another builds a quarterly roadmap from funnel data, customer evidence, and expected revenue impact. The first operator can produce activity without learning. The second creates a repeatable loop:
- Research: Find where shoppers hesitate, exit, or ask the same question.
- Hypothesize: State what should change, for whom, and why.
- Prioritize: Rank ideas by potential, importance, impact, confidence, and ease.
- Test: Run a controlled experiment with defined success and guardrail metrics.
- Learn: Record what happened, including inconclusive and losing tests.
- Roll out: Ship stable winners, then monitor the complete journey.
The gains from that process usually arrive unevenly. A small team may spend one cycle fixing tracking, another clarifying product information, and a later cycle improving checkout or recovery flows. The value comes from accumulated learning, not from a single dramatic button test. For additional practical ideas on improving ecommerce conversion paths, the HarvestMyData outreach strategy offers useful context around reaching and engaging customers.
Practical rule: If you can't explain which funnel step the test targets and which behavior supports the hypothesis, you're not ready to build the variant.
Setting the Baseline and Knowing What Good Looks Like
Every optimization decision inherits the quality of its baseline. Start with the store-wide conversion rate, then separate the two operational rates that reveal where the commercial problem sits: product-page-to-cart rate and checkout completion rate.
Shopify Analytics provides the store's sales and funnel reporting, while GA4 helps you inspect paths, segments, and event behavior. Confirm that the two systems use compatible definitions before comparing them. A rate based on sessions won't necessarily match a rate based on users, and blended reporting can conceal a serious mobile or paid-traffic problem.
Recent independent benchmarks place the global average around 2.35% across industries, with ecommerce commonly around 2.5% to 3.0%. Adobe's benchmark summary says ecommerce websites should generally expect 1% to 4%, while a separate benchmark reports an overall ecommerce rate of 2.03% in June 2026 versus 1.85% in June 2025, a 9.74% year-over-year increase. These figures are directional, not targets, and are documented in the conversion rate benchmark coverage from Greetnow.
Use benchmarks as context, not a scoreboard
Vertical differences matter. One 2026 benchmark set reports food and beverage at 3.8%, electronics at 2.2%, fashion and apparel at 1.5%, and pet supplies at 3.1%. The same benchmark source notes that the top 10% of landing pages can convert 3 to 5 times better than average, reaching 11.5% or more on the strongest pages. See the 2026 conversion optimization benchmark analysis for that comparison.
| Vertical | Avg Rate | Typical Range |
|---|---|---|
| Food and beverage | 3.8% | Varies by offer and traffic intent |
| Electronics | 2.2% | Varies by product complexity |
| Fashion and apparel | 1.5% | Varies by fit and merchandising |
| Pet supplies | 3.1% | Varies by repeat purchase behavior |
A store shouldn't chase a benchmark blindly. A higher conversion rate can still produce less value if the order economics, product mix, or refund profile are weaker. Track revenue per session, average order value, refunds, and contribution margin beside conversion rate.
Segment the baseline by traffic source, device, new versus returning visitors, product type, and landing page. Meta traffic may need more education than email traffic. A returning shopper may need a fast replenishment path rather than a full brand introduction. You can't prioritize intelligently until the baseline shows which step is leaking the most commercial value.
Researching the Right Things Before You Test
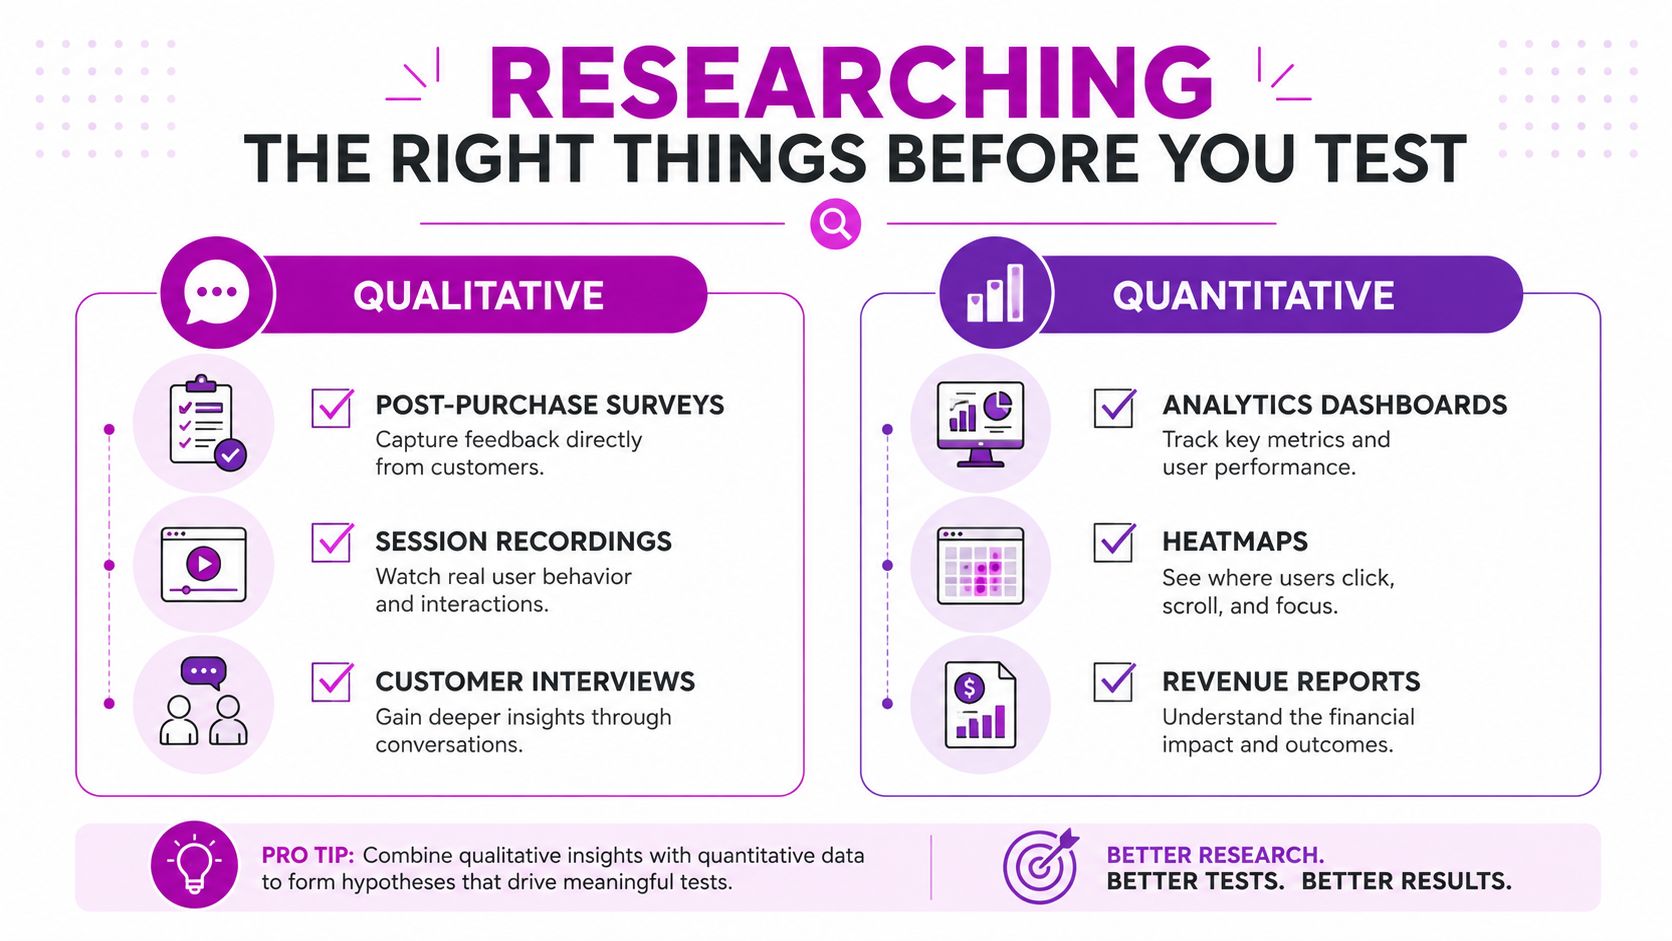
Strong tests begin with evidence that describes a customer problem. The evidence should combine quantitative signals, which show where behavior changes, with qualitative signals, which help explain why.
Start with customer language. Review post-purchase NPS verbatims, tag Gorgias or Zendesk tickets that mention product pages, and collect recurring pre-purchase questions. Read the strongest customer reviews for competing SKUs on Amazon, not to copy the competitor's positioning, but to identify expectations your product page may not address. Schedule three customer interviews per quarter if that cadence is realistic for your team, and ask about the moment before purchase, not only what customers liked afterward.
Build two evidence buckets
Qualitative sources include:
- Support tickets: Group questions about sizing, ingredients, delivery, compatibility, and returns.
- Session recordings: Use Hotjar or Microsoft Clarity to watch hesitation, repeated clicks, and backtracking.
- Heatmaps: Check whether visitors notice the information and calls to action you consider important.
- Customer interviews: Ask what nearly stopped the purchase and what information resolved uncertainty.
- Reviews: Compare objections and desired outcomes across your products and competing offers.
Quantitative sources should answer a different question:
- GA4 path exploration: Identify the routes visitors take before sessions end.
- Shopify funnel reports: Inspect add-to-cart and checkout-step drop-off.
- On-site search: Look for queries that reveal missing products, terminology, or product information.
- Shopify Pixel Helper: Confirm that events fire correctly before trusting the numbers.
A bag brand might see a large product-page bounce and assume the hero image is weak. Recordings may show visitors scrolling directly to the size chart, leaving the page, returning later, and abandoning when fit remains unclear. The sensible response is to move the size chart into a prominent position and test a fit-quiz modal. A new hero image would address the team's preference, not the shopper's friction.
Document each observation in an insight log with the page, audience, evidence, interpretation, and possible response. The voice-of-customer research guide provides a useful framework for turning customer language into usable research inputs. A one-person team can sustain this with 60 minutes each week, then tag and review the log monthly. The output should be quoted evidence and observed behavior, not a mood about the website.
Turning Insights Into Hypotheses With PIE and ICE
Research becomes useful when it produces a falsifiable hypothesis. Use a structure such as:
If we make this change for this audience, then this metric should improve, because the observed evidence indicates this reason.
“Improve the PDP” isn't a hypothesis. “If we place fit guidance beside the variant selector for first-time mobile visitors, add-to-cart rate should improve because recordings show repeated exits to the size chart” is specific enough to test.
Choose the scoring model for the job
PIE means Potential, Importance, and Ease. Score each from 1 to 10. It works well when auditing a full backlog because it asks how much a page can improve, how important the page is to the business, and how practical the change is.
ICE means Impact, Confidence, and Ease, also scored from 1 to 10. It suits a single idea or ad hoc opportunity because it weighs the expected impact, the strength of your evidence, and implementation effort.
The scores are not truth. They're a way to expose assumptions and make trade-offs visible.
| Test Idea | PIE (Potential / Importance / Ease) | ICE (Impact / Confidence / Ease) | Priority Score |
|---|---|---|---|
| Adjust free-shipping threshold messaging | 7 / 8 / 8 | 8 / 7 / 8 | PIE 7.7, ICE 7.7 |
| Add PDP review widget near purchase controls | 8 / 9 / 6 | 7 / 8 / 6 | PIE 7.7, ICE 7.0 |
| Add checkout trust badges | 5 / 8 / 9 | 5 / 6 / 9 | PIE 7.3, ICE 6.7 |
For PIE, calculate the average of the three scores. Do the same for ICE. Then consider the page's traffic, the revenue step affected, engineering risk, and whether the test will produce a useful learning even if it loses. A checkout trust-badge test may be easy, but weak evidence can keep it behind a review-widget test with a clearer customer signal.
Kill ideas early when the evidence is absent, the change bundles unrelated variables, or the expected outcome can't be measured cleanly. Keep an 8 to 12-week roadmap with more ideas than available test capacity, but don't commit every idea to a launch date. Re-score the backlog when new research changes your understanding of the problem.
Setting Up A/B Tests the Right Way on Shopify
A trustworthy experiment starts in a shared sheet, not inside the testing platform. Record the hypothesis, primary metric, guardrails, audience, URL or template, traffic allocation, start condition, stopping rule, owner, and implementation plan. This prevents a common failure mode where the team changes the definition of success after seeing an early result.
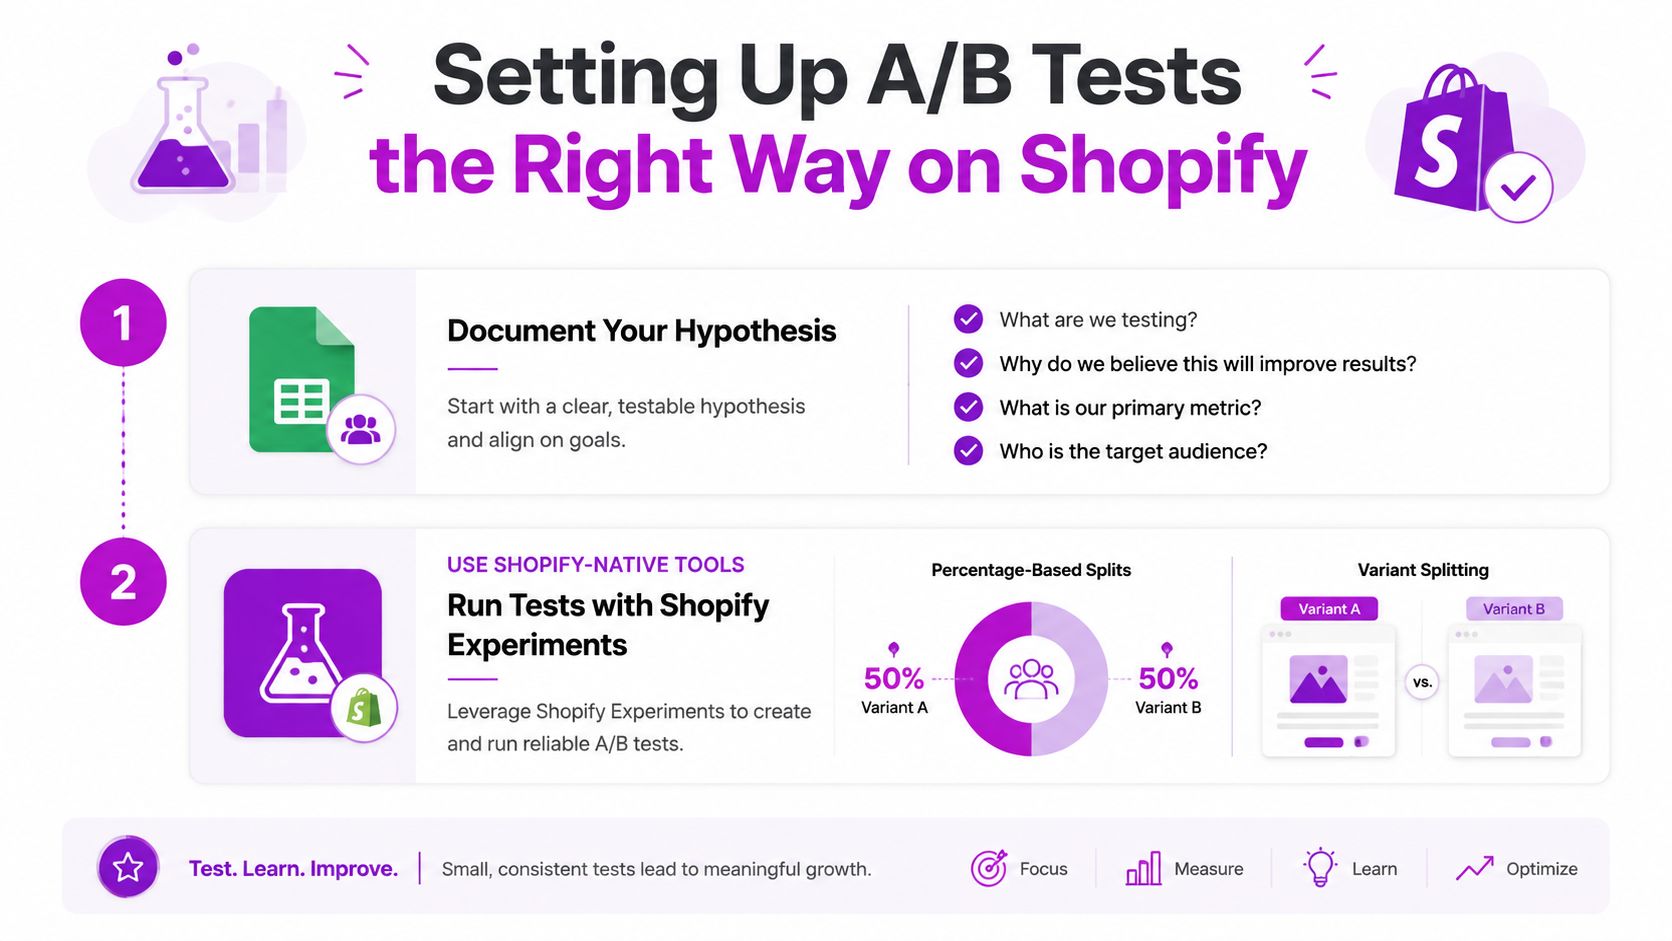
Shopify-native experimentation can work for theme and product-page changes when the implementation supports clean variant allocation and event tracking. For heavier testing needs, platforms such as Convert and VWO offer broader experimentation workflows. Don't choose a tool because it has the longest feature list. Choose the smallest setup that can split traffic, preserve attribution, collect the right events, and produce a result your team can interpret.
Protect the validity of the test
A balanced split is a sensible default for a low-risk interface change. A risky pricing, promotion, or checkout change may justify a conservative allocation while you confirm that the variant renders correctly and doesn't create operational problems. The allocation should be documented before launch, not adjusted because one version looks better after a short period.
Calculate the required sample using your baseline rate and minimum detectable effect. Don't stop just because the dashboard flashes a favorable result after a few days. Use a pre-registered sample size or a fixed test duration that accounts for your traffic pattern, and avoid repeatedly checking results until a temporary spike appears convincing.
Track the full Shopify journey in GA4, including:
- Add to cart: Confirms the product-page or collection-page action.
- Begin checkout: Shows whether cart intent survives into checkout.
- Purchase: Measures the macro conversion.
- Refund events: Protects against a variant that creates low-quality orders.
Before launch, test both variants on mobile and desktop. Check that canonical behavior remains correct, analytics fire once, discount codes still apply, redirects don't break attribution, and returning users aren't switched unpredictably between experiences. Deduplicate test users where the platform requires it, and document how cookies, sessions, and cross-device behavior are handled.
A practical walkthrough of Shopify experimentation mechanics is available in this Shopify A/B testing guide.
Reading Results and Rolling Out Winners
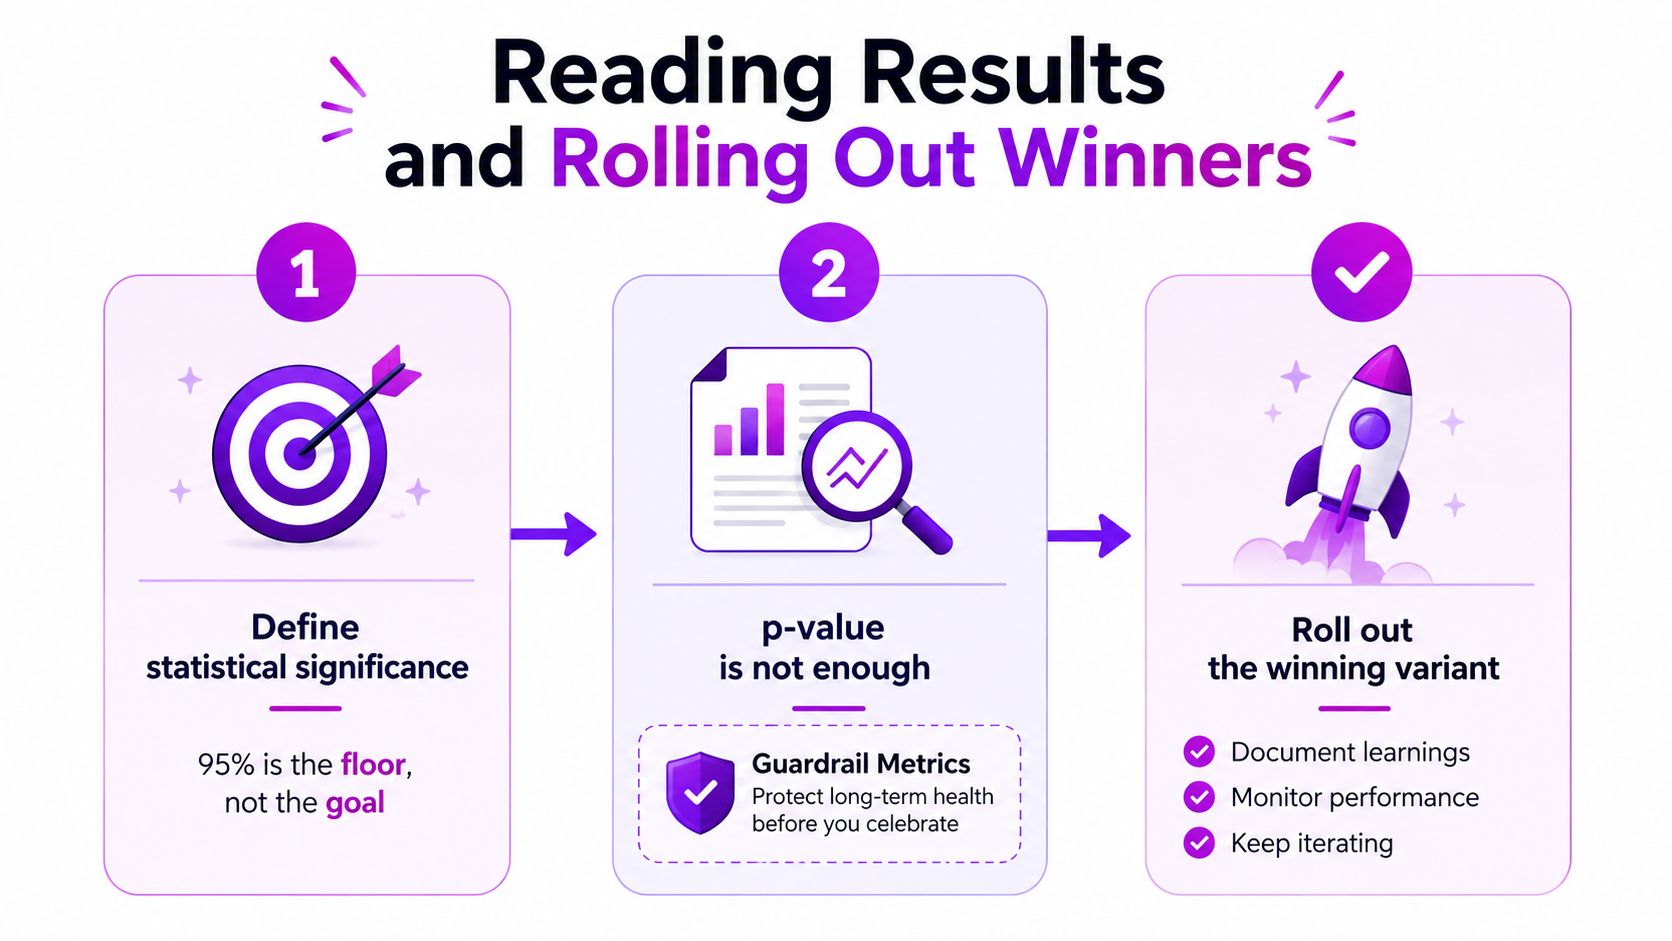
A test result is not a verdict until the measurement conditions are credible. Statistical significance helps estimate whether the observed difference is unlikely to be random under the test model, but it doesn't tell you whether the change matters commercially or whether the result will persist.
Treat 95% significance as a floor, not a goal. A result can reach that threshold while the sample is narrow, the traffic mix is unusual, or the measured lift comes with unacceptable commercial damage. Read the primary conversion metric alongside average order value, refund rate, revenue per session, and page-load performance.
Segment before you celebrate
A flat overall result can hide useful behavior. Split the report by device, new versus returning visitors, traffic source, and relevant product or landing-page context. Don't treat every segment as a separate confirmation. Use segments to form the next question, especially when a mobile improvement appears alongside a desktop decline.
The rollout decision can remain simple:
- Stable winner: If the variant reaches the agreed confidence threshold and guardrails hold, release it to all eligible traffic.
- Directional result: If the result is inconclusive but the evidence is promising, extend the test under the original rules rather than changing the hypothesis.
- Clear loser: Archive the variant with the result, audience, implementation notes, and the learning it produced.
Guardrail check: A conversion lift isn't a win if it increases refunds, lowers order value, slows the page, or attracts orders your operation can't fulfill profitably.
Write a one-paragraph recap for every experiment. State the hypothesis, audience, primary result, guardrail outcome, decision, and next action. That small habit turns isolated tests into institutional knowledge and prevents a junior marketer or freelancer from repeating an old mistake.
Common CRO Mistakes and Your 90-Day Action Plan
Most Shopify CRO programs don't fail because the team lacks ideas. They fail because the team can't distinguish a useful experiment from an unstructured change.
Ask these questions before the next sprint:
- No hypothesis: What customer evidence says this change should affect behavior?
- Premature stopping: Did the test follow its planned sample or duration, or did the team stop at the first favorable signal?
- Too many variables: If copy, price, imagery, and offer changed together, what exactly did the team learn?
- Mobile neglect: Does the mobile funnel have its own evidence and review, rather than inheriting desktop assumptions?
- Button obsession: Is the primary problem color, or is the offer unclear, the fit uncertain, or the shipping promise hidden?
- Tracking gaps: Can Shopify and GA4 account for the same key actions without duplication or missing events?
A disciplined plan gives a small team enough structure without pretending it has unlimited traffic or engineering capacity.
Days 1 to 14
Audit Shopify Analytics, GA4, pixels, purchase events, refunds, and funnel definitions. Capture baseline conversion by traffic source, device, new versus returning visitor, and important product templates. Review session recordings, customer feedback, support tickets, on-site search, and checkout exits. Fix measurement defects before prioritizing design work.
Days 15 to 45
Create the insight log and turn the strongest observations into hypotheses. Score the backlog with PIE and ICE, then select the first two experiments based on impact, evidence, effort, and learning value. Pre-register the sample-size approach, primary metric, guardrails, traffic allocation, and stopping rule before either test launches.
Days 46 to 90
Stack additional experiments only when the team can protect test integrity. Record results in a shared wiki, roll stable winners into the theme, and retain a holdback when the business needs further validation. Review whether the change affected revenue per session, average order value, refunds, and customer quality, not only the conversion rate.
Keep the weekly cadence lightweight:
- Monday: Review funnel movement and new customer evidence.
- Midweek: Watch recordings and update the insight log.
- Thursday: QA active tests and check event collection.
- Friday: Record decisions, learnings, and the next queued hypothesis.
The privacy environment also changes how mature CRO teams work. Current industry coverage points toward first-party data, consented tracking, zero-party data, trust signals, and AI-assisted optimization, while warning that more personalization isn't automatically better. The CRO trends analysis from WebFX supports a measurement-first approach, where clean data and customer trust come before additional complexity.
ECORN provides Shopify conversion research, funnel audits, CRO strategy, testing support, Shopify development, and Shopify Plus consulting for brands that need diagnosis turned into implementation. If you want a practical CRO roadmap built around your store's evidence and priorities, visit ECORN to discuss the next experiment.



Shopify Design Essentials Every Store Owner Needs
Ecommerce Terms of Service: How to Draft and Implement
How to Implement Structured Data for Ecommerce in 2026

SEO App Mobile: Shopify Store Optimization Guide
Shopify Plus Support: What It Includes and How to Choose

Google Ads for Shopify: The Complete 2026 Playbook

Shopify New York: How to Find and Hire the Right Agency
Google Search Console for Shopify: The Complete Setup

First Party Data Collection for eCommerce Growth
FAQ Online Store Guide: Build and Measure It Right
Do FB Ads Work for eCommerce in 2026?
One Page Checkout for Shopify: Design and Implementation
Shopify GraphQL vs REST: The 2026 Developer Decision
Shopify Ecommerce Consulting: Strategy, Pricing &

Are Reddit Ads Worth It for eCommerce Brands
Shopify Title and Meta Description: A Practical 2026 Guide

Product Video Best Practices for Shopify Brands
Real-Time Inventory Management: A 2026 Guide

AI Chatbot Integration for Shopify Stores
Affiliate Program Management: A Shopify Guide
10 Best Performance Monitoring Tools for Shopify in 2026

Digital Asset Management for eCommerce Brands in 2026
Every Type of Facebook Ads Explained for eCommerce Growth
Product Information Management Explained for Shopify Brands
Support Ticket System: A Guide for Shopify Stores

10 Best Customer Service Tools for Shopify in 2026

Can I Start a Business with No Money? a 2026 Blueprint

What Sells Good on Etsy: Best Niches for 2026

Shopify Add to Cart Button: A Practical 2026 Guide

Customer Feedback Automation: A Practical eCommerce Guide
Critical Rendering Path: A Guide for Shopify Stores

How to Promote on TikTok for eCommerce in 2026

B2B eCommerce Consulting That Drives Real Revenue
10 Best Practices for Site Navigation in 2026
Return vs Refund for Shopify Stores: A Practical Guide
What Is Customer Lifetime Value and Why It Matters
What Is Voice of Customer Research for eCommerce

SMS Marketing for Ecommerce That Actually Converts

Master How to Improve Email Deliverability in 2026

Top 7 eCommerce Partners NYC for Shopify Brands in 2026

Machine Learning for Ecommerce: Boost Your Shopify Store

Beauty Market Research: Your 2026 Growth Guide

Shopify International Expansion: A 2026 Roadmap
What Does CRO Stand for in Business: Understanding CRO

Shopify Visual Merchandising: A Playbook for Higher Sales

Shopify Landing Page Design: Master Conversion in 2026
10 Best AI SEO Optimization Tools for Shopify in 2026

Agentic AI for Ecommerce: Boost Your Sales in 2026
Mastering Email Marketing Data for eCommerce Growth

Conversion Rate Optimisation Australia: Boost Your Sales
Conversion Rate Optimization AI: Your Shopify Store Guide

10 Product Bundling Strategies for Shopify in 2026
How to Increase Customer Lifetime Value: A Shopify Playbook
AI Customer Service Automation: Shopify Guide 2026

Clean Website Design: A Shopify Conversion Playbook

Omnichannel Retail Strategy: A Shopify Playbook
Product Data Enrichment: A Guide for Shopify Brands

Instagram Shopping Features a Guide for Shopify Stores
What Is Revenue Optimization: A Holistic RevOps Guide

Benefits of Conversion Rate Optimization: Boost Your
WordPress to Shopify Migration: Your 2026 Seamless Switch
Boost Sales: Ecommerce Payment Processing Guide 2026
Unified Commerce Platform: Benefits, KPIs & Shopify Guide

How to Reduce Bounce Rate eCommerce: Your 2026 Guide
Shopify API Integration: A Practical End-to-End Guide

How to Implement Data Governance: A 2026 Guide
Shopify Store Development Cost: A 2026 Breakdown
What Is Server Side Tracking: The Shopify Guide 2026
Marketing Automation Workflows: A Shopify Guide for 2026

Shopify: How to Reduce Technical Debt

Shopify UX Design Change: A Playbook for Growth
User Generated Content Strategy: Shopify Playbook

Shopify Pause and Build Plan Cost: A Complete 2026 Guide

Compare at Price on Shopify: A Complete Guide for 2026

Where Can I Sell My Prints? 10 Best Platforms for 2026
Shopify Order Management System: The Ultimate Guide 2026
What Is Marketing Attribution? an eCommerce Guide for 2026

10 Best Black Friday Sales Sheets for 2026

Discover the Top Social Media Marketing Agencies For
Consumer Confidence Definition for eCommerce in 2026
What Is Social Commerce? Your 2026 Guide to Boosting Sales

A Social Ad Campaign Playbook for eCommerce Growth

7 Best FAQ Page Examples for SaaS & eCommerce

Market Research in Fashion Industry: A Guide for Shopify

Shopify Migration Services: Expert Guide for 2026

Mastering FB Retargeting Ads for Shopify in 2026
What Is Omnichannel Ecommerce

Master Your Shopify Plus Migration: The 2026 Guide
Shopify Integration Services: A Merchant's 2026 Guide
Shopify Collection Description: A Guide to SEO & Sales

Shopify Plus Contact: Reach Sales & Support Effectively

Top Luxury Shopify Stores: Design & UX Strategies
How to Improve Customer Experience: A Shopify Roadmap

Creative Facebook Ads: 10 Examples for Shopify Brands

Remarketing with Facebook Ads: A Shopify Guide for 2026

SEO Linking Strategies for Shopify Stores
Top 7 Statistics YouTube Channels for eCommerce in 2026

Hiring Shopify Plus Designers: A Founder's Guide

Shopify Product Variation: Master Your Variants for 2026

Leverage Ai Solutions Brands: Your 2026 Shopify Growth Guide


newsletter in your inbox