

Your Shopify store can look healthy in one browser tab and still leak sales for your customers. A product page may load fast for you on desktop, then feel sluggish on mobile, or your checkout may stay up while a third-party script drags the experience down for paying customers. That is why performance monitoring tools matter, they move you from gut feel to evidence you can act on.
Shopify teams usually need two kinds of visibility. The first is front-end monitoring, which shows how pages feel to shoppers, including Core Web Vitals, page speed, and checkout friction. The second is full-stack monitoring, which helps when the storefront depends on APIs, custom apps, microservices, or edge services, the kind of complexity that observability models were built to handle after Gartner's 2019 shift from narrow APM to broader traces, metrics, and logs (WorldMetrics on performance monitoring and observability).
1. SpeedCurve
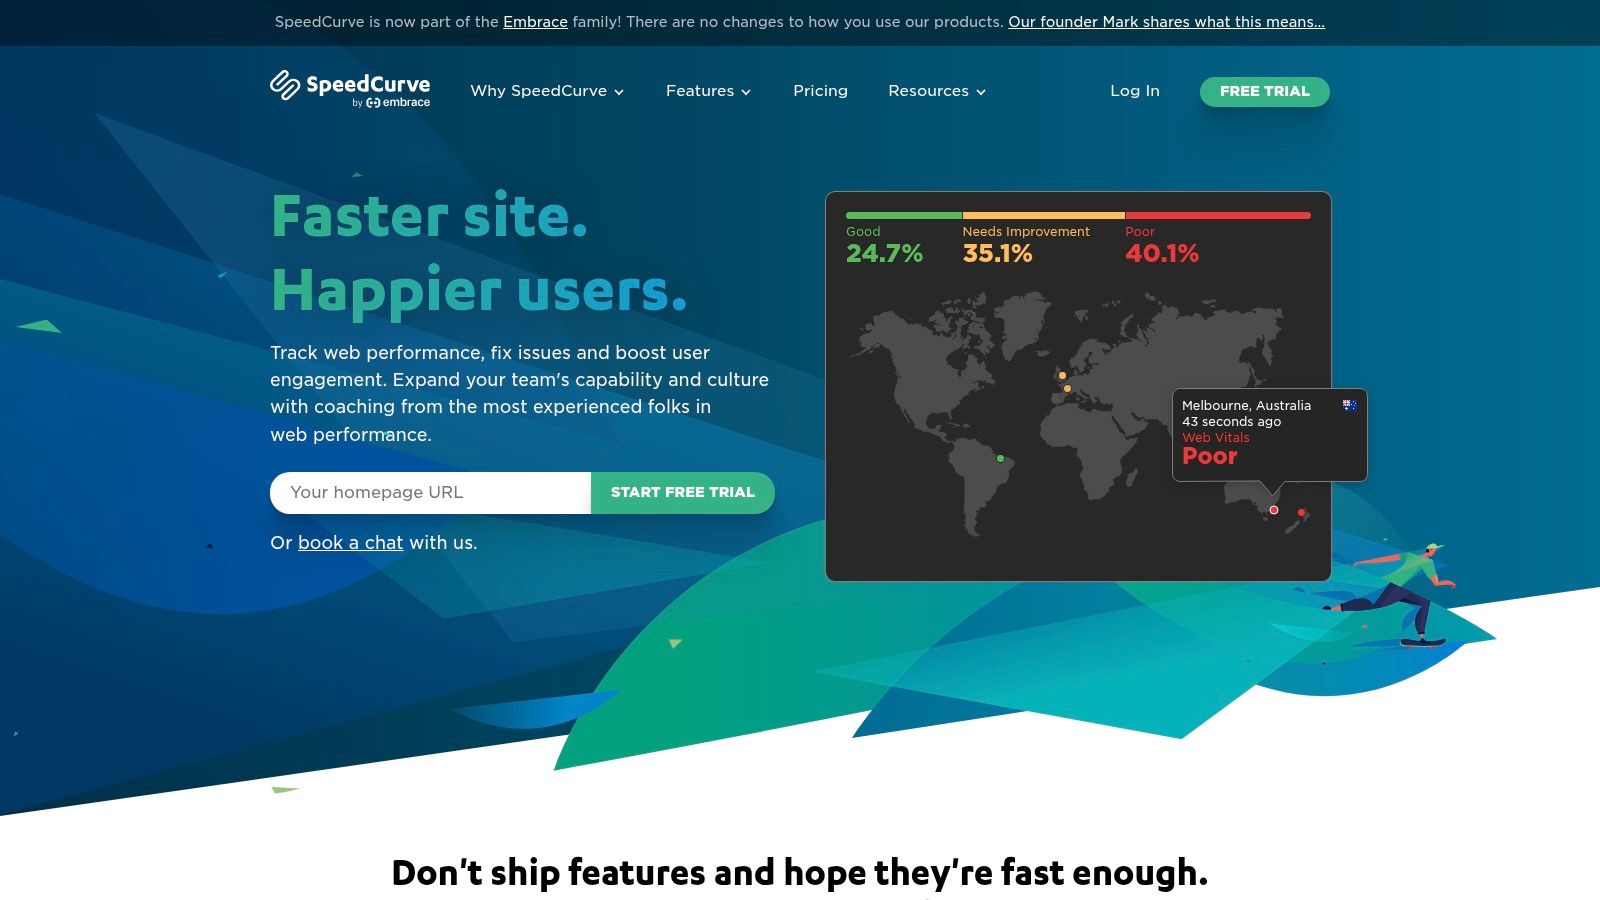
SpeedCurve is a strong fit when the main problem is storefront experience, not server-side incident hunting. It combines synthetic testing and real user monitoring in one workflow, which is useful when theme changes, app installs, or merchandising updates affect how pages render for real shoppers. Its native Shopify RUM app also reduces implementation friction, which matters when development time is tight.
Why Shopify teams reach for it
SpeedCurve makes sense for teams that care about Core Web Vitals, visual stability, and change tracking. The big advantage is not just the metrics, it's the way the product ties performance budgets to UX outcomes so marketers, designers, and developers can read the same signal. That's especially useful during theme refactors, app swaps, or landing page experiments.
Practical rule: if the question is “did our storefront feel slower after the last release?”, a front-end specialist like SpeedCurve is usually a better first stop than a full observability suite.
The trade-off is straightforward. SpeedCurve is not a full-stack APM replacement, so if the slowdown starts in a backend service or an external integration, you'll still need deeper application visibility somewhere else. For teams that want a Shopify-friendly install path and front-end-first diagnostics, it's one of the most practical choices. ECORN's guide to measuring website performance pairs well with this mindset, because the primary win comes from measuring the right page signals before you try to optimize them.
Best fit
- Shopify startups that need visibility into homepage, product page, and checkout speed
- Merchandising teams that want simple reporting around page changes
- Developers who need RUM without a heavy instrumentation project
2. Calibre
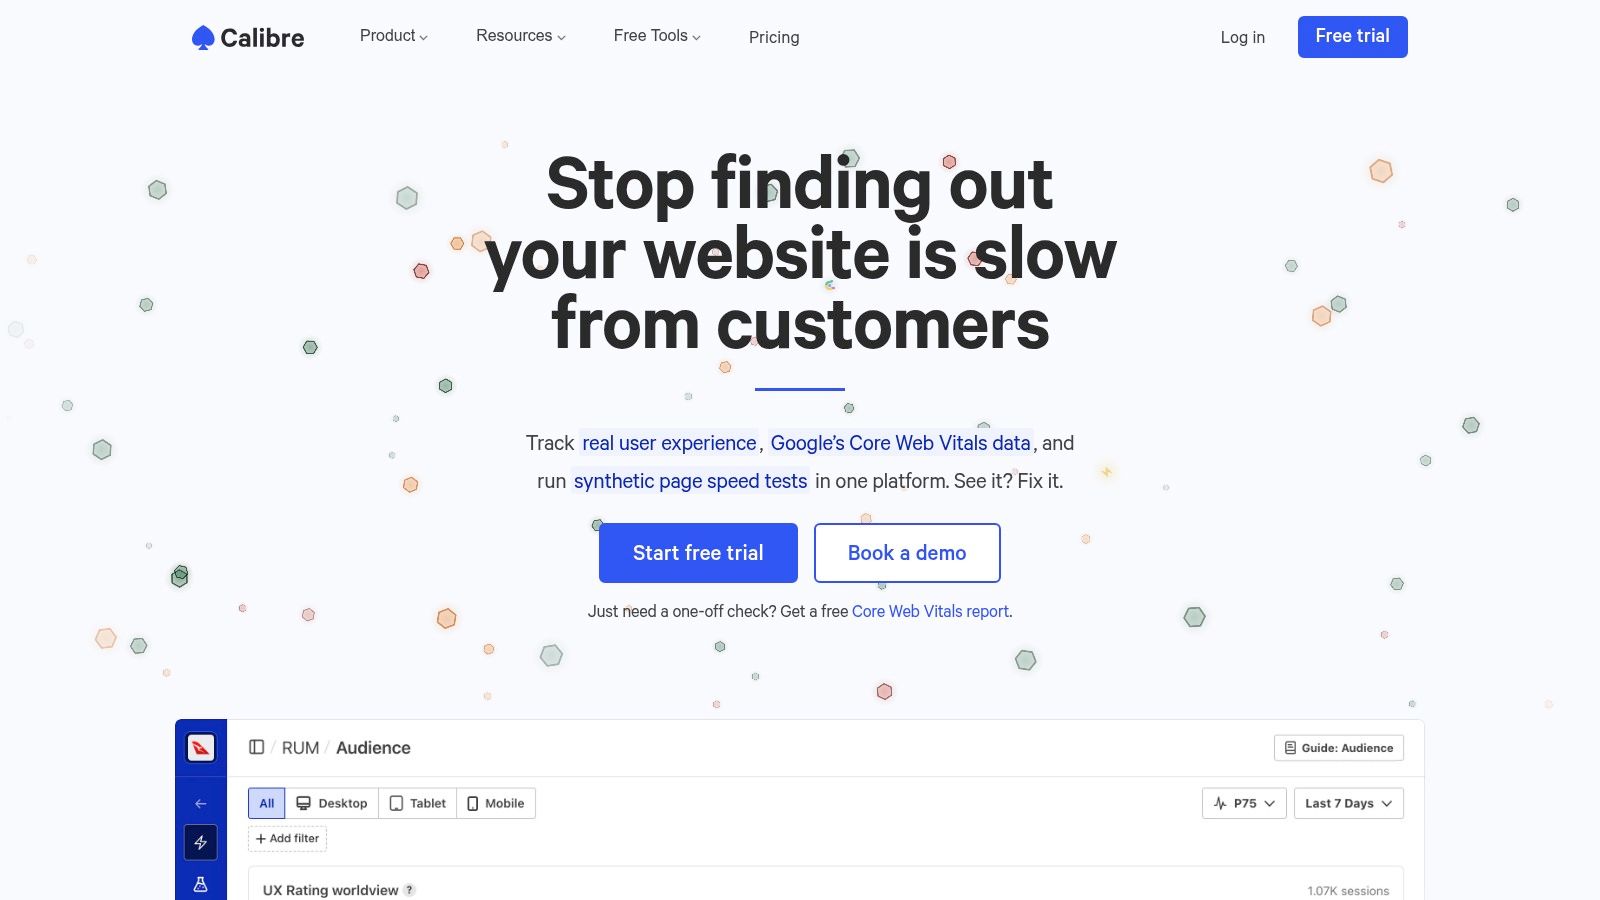
Calibre is a good option for teams that want predictable web monitoring without building a sprawling observability stack. It brings together real user monitoring, synthetic testing, and Google CrUX data, which gives non-technical stakeholders a cleaner view of how the store performs in the wild versus in scripted tests. For agencies and multi-storefront operators, the appeal is often the allocation model, not just the feature list.
Where it fits in daily work
The practical value of Calibre is that it covers both user-centric and test-based performance signals in one place. That makes it easier to compare what your synthetic test saw during a release window with what real shoppers experienced afterward. It also helps marketing and operations teams discuss performance without asking engineering to translate every chart.
Good monitoring tools reduce argument, not just latency.
Calibre works well when you need to keep an eye on multiple storefronts, teams, or clients and want a setup that's easier to govern than a large enterprise platform. The downside is that it remains a web performance tool, so it complements back-end tracing rather than replacing it. If your Shopify stack is simple, that's fine. If your checkout relies on custom services or heavy middleware, you'll need another layer for deeper diagnostics.
Best fit
- Agencies managing several Shopify properties
- Growth-stage merchants who need clear reporting and predictable allocation use
- Teams that want synthetic, RUM, and CrUX data without a heavy platform footprint
3. Pingdom
Pingdom is one of the easiest tools to deploy when the priority is availability and basic front-end checks. It is especially useful for monitoring critical Shopify journeys such as product pages, cart steps, and checkout paths, because the setup is fast and the alerts are easy to understand. For smaller teams, that usually matters more than deep diagnostic power.
What it does well
Pingdom's strength is clarity. It gives operators a clean way to track uptime, transaction checks, page speed, and alerting without a steep learning curve. That makes it a good fit for merchants who need to know quickly whether a failure is affecting a buying journey, not just a server.
The trade-off is depth. Pingdom is helpful for front-end availability and basic synthetic testing, but it won't give you the same level of application tracing or infrastructure correlation you'd get from a full observability platform. That's not a flaw if your store is relatively straightforward. It becomes a limitation when custom apps, APIs, or multi-service workflows begin to shape the customer experience.
Best fit
- Startup and early-growth stores that need simple uptime and page-speed monitoring
- Operators who want business-friendly dashboards and alerts
- Teams looking for quick deployment over deep instrumentation
4. Catchpoint
Catchpoint is the right conversation when the problem is no longer “is the site up?” but “where is the internet path breaking down?” It is built for enterprise internet performance monitoring, which makes it valuable for globally distributed Shopify businesses that need more than a basic uptime check. If your storefront depends on CDNs, third-party services, or regional routing behavior, Catchpoint gives you a broader view.
Why it stands out
Catchpoint's value comes from synthetic depth and internet-layer visibility. That makes it useful when a storefront feels slow in some regions, or when the bottleneck sits outside your codebase altogether. For teams running more advanced performance programs, the commercial WebPageTest stack adds room for bulk tests, private tests, and experiments.
The trade-off is complexity. Catchpoint is heavier than SMB-oriented tools, and that shows up in both cost and learning curve. It's a better fit for teams that already know they need global visibility and can support a more in-depth monitoring process. For Shopify merchants at that stage, the right question is not whether the tool is powerful. It is whether the team will effectively use the extra depth.
Best fit
- Shopify Plus and international brands
- Teams that need DNS, CDN, and internet-health visibility
- Organizations that run structured performance experiments
ECORN's Shopify page speed optimization guide is a useful companion here, because once you can see network and rendering issues clearly, the next step is usually fixing the theme, script load, or asset strategy that caused them.
5. Datadog
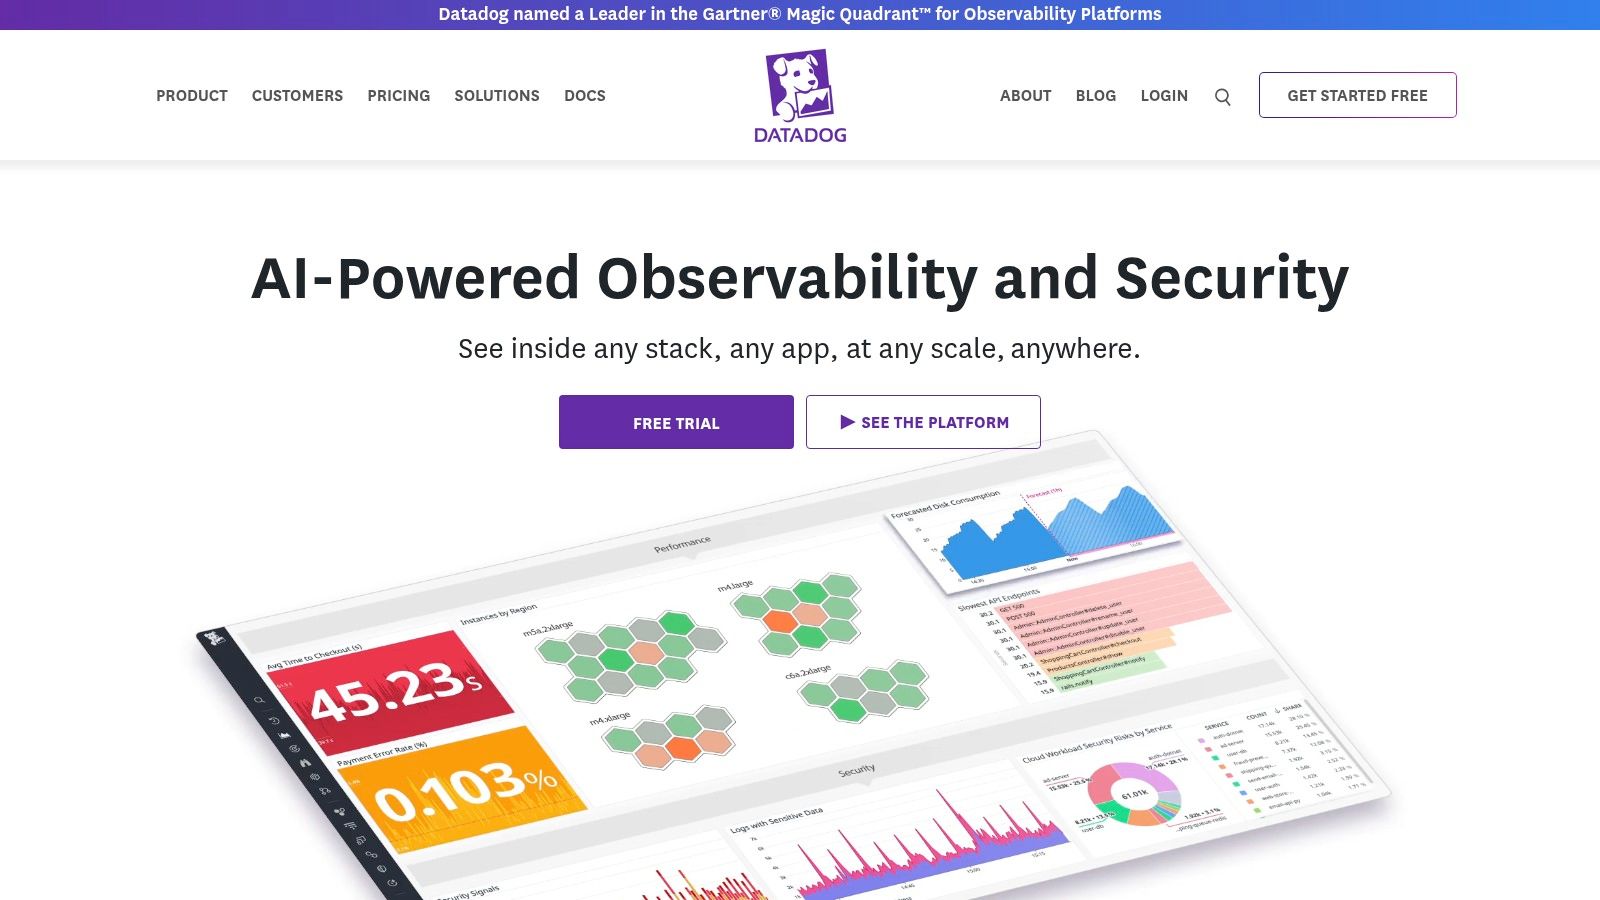
Datadog is the tool to consider when Shopify performance is tied to custom apps, APIs, containers, or microservices. It combines APM, tracing, RUM, session replay, product analytics, and synthetic monitoring in one platform, which makes it attractive for headless builds and more technical commerce stacks. It is less of a single-purpose storefront monitor and more of a control plane for the whole environment.
Where Datadog earns its keep
Datadog helps when the business question is connected to a technical chain of events. A shopper experiences lag, an API call slows down, and a backend service becomes the primary bottleneck. That kind of full-stack correlation is exactly where a platform with logs, traces, metrics, and user experience data can save time.
Best use case: use Datadog when one Shopify transaction can touch multiple systems and you need to see the whole path, not just the browser.
The downside is cost governance. Once you turn on more modules, forecasting gets harder, and the platform is best handled by teams that can manage instrumentation and budget discipline together. For a simple Shopify theme, Datadog is probably too much. For a modern commerce stack with custom services, it's often the right level of power.
Best fit
- Headless and composable commerce teams
- Engineering-heavy merchants with custom services
- Operators who need one platform across browser, backend, and infrastructure signals
6. New Relic
New Relic is a strong middle ground for teams that want broad observability without jumping straight into the heaviest enterprise rollout. It brings together APM, Browser RUM, Synthetics, infrastructure, logs, and traces, so growing brands can start with a limited footprint and expand as their stack gets more complex. For Shopify businesses that are outgrowing point tools, that flexibility is valuable.
Why growing brands like it
The practical advantage of New Relic is consolidation. Instead of using separate tools for browser issues, infra alerts, and trace analysis, teams can work from one platform and gradually extend coverage. That helps when a store starts with a theme and apps, then evolves into custom integrations and service dependencies.
Its pricing model needs governance. Usage-based tools can become messy if you don't watch ingest, retention, and user counts closely. But for teams that want a broad observability surface and don't want to overbuy upfront, New Relic is often easier to justify than a larger enterprise commitment.
Best fit
- Growth-stage Shopify brands
- Teams consolidating multiple point tools
- Organizations that want room to expand from front-end visibility into full-stack observability
7. Dynatrace
Dynatrace belongs in the enterprise observability conversation. It is designed for full-stack monitoring across databases, containers, Kubernetes, and user experience, with RUM and synthetic actions priced on a published basis. That makes it especially relevant for Shopify Plus organizations that need strong correlation between customer experience and infrastructure behavior.
What makes it different
Dynatrace is a good fit when the storefront sits inside a larger estate and the team needs correlation across many layers. It helps answer questions like whether latency came from the browser, the app, the database, or a containerized dependency. That kind of structured visibility is exactly what enterprise teams need when customer experience and operational risk overlap.
The trade-off is obvious. Dynatrace can be overkill for smaller stores, and implementation planning matters. If your Shopify environment is simple, the overhead will feel unnecessary. If your business already runs a complex, multi-service architecture, the depth can pay off quickly because the platform is built for that level of sprawl.
Best fit
- Shopify Plus teams
- Large commerce estates with Kubernetes or multi-service back ends
- Operations teams that need published pricing and enterprise-grade observability depth
8. AppDynamics
AppDynamics is built for organizations that want to connect technical performance to business outcomes. Its business transaction mapping and Business IQ style analytics help teams follow the relationship between application behavior, revenue, and conversion. That makes it relevant when leadership wants monitoring reports that speak in commercial terms, not just CPU and response time.
When it earns a place
AppDynamics works well in enterprise settings where procurement, governance, and reporting matter as much as raw monitoring depth. It gives teams a way to discuss performance in terms that CRO, finance, and leadership can use, which is helpful when a slowdown affects revenue-sensitive journeys like checkout or high-value product paths.
The trade-off is that it tends to be heavier than front-end specialist tools and pricing is quote-based. For SMB Shopify stores, that can make it harder to justify. For larger portfolios with formal governance and a need to tie app health to business metrics, it can be a strong fit.
Best fit
- Enterprise commerce organizations
- Leadership teams that need business-centric reporting
- Shopify portfolios with governance and compliance requirements
9. Sentry
Sentry is the practical choice for teams that want error tracking and performance monitoring together. It is developer-friendly, fast to roll out, and especially useful for front-end apps, Node-based services, and serverless pieces around Shopify. Instead of forcing teams to jump between separate error and performance tools, it keeps the workflow tighter.
Why teams adopt it
Sentry's appeal is time-to-value. Developers can connect tracing, profiling, session replay, and application metrics without waiting for a huge observability rollout. That makes it especially useful when a Shopify team wants to find out whether a bad release, a noisy app, or a Node service is hurting the customer experience.
Useful habit: pair Sentry alerts with release tracking so you can separate new regressions from long-running issues.
The limitation is depth. Sentry gives you useful APM-lite visibility, but it doesn't try to replace the full infrastructure and Kubernetes coverage of larger suites. That is fine for teams that care most about shipping quickly and catching regressions fast.
Best fit
- Engineering-led Shopify teams
- Storefronts with Node, web, or serverless components
- Teams that want a tight link between errors and performance signals
10. Raygun
Raygun works well for JS-heavy storefronts that need RUM, crash reporting, and APM in one place. It is straightforward to instrument and easy to read, which makes it appealing for teams that want a practical tool rather than a platform they need to study for weeks. For eCommerce businesses, that simplicity can keep adoption high.
What makes it practical
Raygun is useful when the team wants to trace the relationship between browser behavior, application crashes, and deployment changes. Its usage capping and add-ons also give operators a way to keep cost volatility in check, which matters when traffic grows or a test environment starts producing more noise than expected.
The trade-off is ecosystem depth. Raygun is not as broad as the mega-suite vendors, so large organizations may outgrow it if they need a huge integration catalog or extensively layered enterprise workflows. For smaller and mid-sized Shopify stores, though, that narrower focus can be an advantage because the tool stays easy to use.
Best fit
- JS-heavy Shopify storefronts
- Teams that want a simple UI and fast rollout
- Merchants who need crash reporting plus performance visibility
Top 10 Performance Monitoring Tools Comparison
| Tool | Key features | UX / Quality ★ | Pricing / Value 💰 | Target audience 👥 | Unique selling points ✨🏆 |
|---|---|---|---|---|---|
| SpeedCurve | Synthetic + RUM, Core Web Vitals, Shopify RUM app, CI/CD tracking | ★★★★ | 💰 Quote-based (contact sales) | 👥 Front-end eCom teams, Shopify stores | ✨ Native Shopify RUM app, fast UX-focused insights, 🏆 front-end specialist |
| Calibre | RUM + Synthetic + Google CrUX, seats/SSO, API, long snapshot retention | ★★★★ | 💰 Transparent plans, predictable allocations | 👥 Agencies & multi-storefront teams | ✨ Predictable allocations & long retention, 🏆 agency-friendly pricing model |
| Pingdom (SolarWinds) | Synthetic transactions, uptime, page speed tests, alerts/status pages | ★★★ | 💰 Cost-effective entry, modular add-ons | 👥 SMBs, ops teams needing uptime checks | ✨ Very quick setup & alerting integrations |
| Catchpoint (incl. WebPageTest) | Advanced global synthetic agents, RUM/session replay, DNS/CDN/BGP telemetry | ★★★★★ | 💰 Enterprise-tier pricing | 👥 Large/global storefronts, CDN/network-sensitive sites | ✨ WebPageTest Pro features + internet-layer visibility, 🏆 gold-standard synthetic depth |
| Datadog | APM/tracing, RUM, session replay, synthetics, integrations & incident workflows | ★★★★★ | 💰 Published module pricing (can be costly at scale) | 👥 Headless/custom-app architectures, engineering teams | ✨ Browser→backend unified observability, 🏆 extensive integration ecosystem |
| New Relic | APM, Browser RUM, Synthetics, logs/traces, OpenTelemetry support | ★★★★ | 💰 Usage-based; generous free ingest tier | 👥 Growing brands wanting to start small & scale | ✨ Generous free tier & consolidation potential, 🏆 broad platform coverage |
| Dynatrace | AI-assisted full-stack, RUM/session replay, synthetics (per action), infra analytics | ★★★★★ | 💰 Published rate-card; enterprise-focused | 👥 Shopify Plus & complex infra estates | ✨ AI correlation of UX↔infra, 🏆 strong automation & analytics |
| AppDynamics (Cisco) | Full-stack APM, Browser RUM, Business IQ, on-prem & SaaS options | ★★★★ | 💰 Quote-based enterprise pricing | 👥 Enterprises needing governance & business metrics | ✨ Business-to-performance correlation, 🏆 mature enterprise feature set |
| Sentry | Error tracking + performance (traces/profiling), session replay, SDKs | ★★★★ | 💰 Developer-friendly plans + performance units | 👥 Engineering teams, Node/JS Shopify apps | ✨ Tight error↔performance pairing, 🏆 fast time-to-value for devs |
| Raygun | Error/crash reporting, RUM, APM, usage capping & spike protection | ★★★ | 💰 Public pricing for SMBs; enterprise via contact | 👥 JS-heavy storefronts & mobile apps | ✨ Usage capping & easy instrumentation, 🏆 simple ops for front-end teams |
Take Control of Your Store's Performance
The right performance monitoring tools do more than flag slow pages. They show you whether the problem sits in the browser, the theme, a third-party script, or a deeper application layer, and that clarity is what helps teams fix the right thing first. For Shopify merchants, the choice usually comes down to focus. Front-end tools are best when the issue is page speed, checkout friction, or visual responsiveness. Full-stack platforms matter when custom apps, APIs, and infrastructure start shaping the customer journey.
A practical way to choose is to match the tool to your business stage. A startup usually needs simple visibility and fast setup, so a front-end specialist or lightweight synthetic monitor is often enough. A growth-stage brand benefits from RUM, synthetic tests, and clearer stakeholder reporting. Shopify Plus teams usually need broader observability, stronger correlation, and governance that can keep pace with a more complex stack.
The market is moving in that direction for a reason. The application performance management market was estimated at USD 4.36 billion in 2023 and is projected to reach USD 9.90 billion by 2030, with a 13.4% CAGR according to Grand View Research (market analysis). The same analysis notes that the web APM segment held over 66% share in 2023, which lines up with what Shopify teams already know, storefront visibility is still the dominant need for most merchants.
What matters next is implementation. Pick one tool, wire it into the places your customers feel latency, and use its alerts to catch regressions before they become lost orders. If your team wants help choosing the right monitoring setup for a Shopify launch, replatform, or performance recovery project, ECORN can help you turn browser data and commerce goals into a cleaner optimization plan.
ECORN helps Shopify brands connect performance monitoring with practical CRO and development work, so you can fix the issues that affect revenue instead of staring at noisy dashboards. If you want support choosing the right monitoring stack for your store, visit ECORN and start a conversation about your Shopify performance goals.



How to Choose the Right eCommerce Website Development Firm
E Business Strategy Implementation
Conversion Tracking Setup for Shopify Stores
BigCommerce vs Shopify Plus Which Enterprise Wins in 2026
Shopify Theme Kit: Setup, Commands, and Migration Guide

Shopify Extension Development: A Practical 2026 Guide
Shopify Speed Score Explained and How to Improve It
Shopify Mobile Optimization: The 2026 Playbook

How to Add Subcategory in Shopify for Better UX
How to Implement Structured Data for Ecommerce in 2026

SEO App Mobile: Shopify Store Optimization Guide

Shopify Plus Support: What It Includes and How to Choose

Google Ads for Shopify: The Complete 2026 Playbook

Shopify New York: How to Find and Hire the Right Agency

Google Search Console for Shopify: The Complete Setup

First Party Data Collection for eCommerce Growth

FAQ Online Store Guide: Build and Measure It Right

Do FB Ads Work for eCommerce in 2026?

One Page Checkout for Shopify: Design and Implementation
Shopify GraphQL vs REST: The 2026 Developer Decision
Shopify Ecommerce Consulting: Strategy, Pricing &

Are Reddit Ads Worth It for eCommerce Brands

Shopify Title and Meta Description: A Practical 2026 Guide

Product Video Best Practices for Shopify Brands
Real-Time Inventory Management: A 2026 Guide
AI Chatbot Integration for Shopify Stores
Affiliate Program Management: A Shopify Guide

Digital Asset Management for eCommerce Brands in 2026

Every Type of Facebook Ads Explained for eCommerce Growth
Product Information Management Explained for Shopify Brands
Support Ticket System: A Guide for Shopify Stores

10 Best Customer Service Tools for Shopify in 2026

Can I Start a Business with No Money? a 2026 Blueprint

What Sells Good on Etsy: Best Niches for 2026

Shopify Add to Cart Button: A Practical 2026 Guide

Customer Feedback Automation: A Practical eCommerce Guide
Critical Rendering Path: A Guide for Shopify Stores

How to Promote on TikTok for eCommerce in 2026

B2B eCommerce Consulting That Drives Real Revenue
10 Best Practices for Site Navigation in 2026
Return vs Refund for Shopify Stores: A Practical Guide

What Is Customer Lifetime Value and Why It Matters

What Is Voice of Customer Research for eCommerce

SMS Marketing for Ecommerce That Actually Converts

Master How to Improve Email Deliverability in 2026

Top 7 eCommerce Partners NYC for Shopify Brands in 2026

Machine Learning for Ecommerce: Boost Your Shopify Store

Beauty Market Research: Your 2026 Growth Guide

Shopify International Expansion: A 2026 Roadmap

What Does CRO Stand for in Business: Understanding CRO

Shopify Visual Merchandising: A Playbook for Higher Sales

Shopify Landing Page Design: Master Conversion in 2026
10 Best AI SEO Optimization Tools for Shopify in 2026

Agentic AI for Ecommerce: Boost Your Sales in 2026
Mastering Email Marketing Data for eCommerce Growth

Conversion Rate Optimisation Australia: Boost Your Sales
Conversion Rate Optimization AI: Your Shopify Store Guide

10 Product Bundling Strategies for Shopify in 2026

How to Increase Customer Lifetime Value: A Shopify Playbook
AI Customer Service Automation: Shopify Guide 2026

Clean Website Design: A Shopify Conversion Playbook

Omnichannel Retail Strategy: A Shopify Playbook

Product Data Enrichment: A Guide for Shopify Brands

Instagram Shopping Features a Guide for Shopify Stores
What Is Revenue Optimization: A Holistic RevOps Guide

Benefits of Conversion Rate Optimization: Boost Your
WordPress to Shopify Migration: Your 2026 Seamless Switch
Boost Sales: Ecommerce Payment Processing Guide 2026
Unified Commerce Platform: Benefits, KPIs & Shopify Guide

How to Reduce Bounce Rate eCommerce: Your 2026 Guide
Shopify API Integration: A Practical End-to-End Guide

How to Implement Data Governance: A 2026 Guide
Shopify Store Development Cost: A 2026 Breakdown
What Is Server Side Tracking: The Shopify Guide 2026
Marketing Automation Workflows: A Shopify Guide for 2026

Shopify: How to Reduce Technical Debt

Shopify UX Design Change: A Playbook for Growth

User Generated Content Strategy: Shopify Playbook

Shopify Pause and Build Plan Cost: A Complete 2026 Guide

Compare at Price on Shopify: A Complete Guide for 2026

Where Can I Sell My Prints? 10 Best Platforms for 2026
Shopify Order Management System: The Ultimate Guide 2026

What Is Marketing Attribution? an eCommerce Guide for 2026

10 Best Black Friday Sales Sheets for 2026

Discover the Top Social Media Marketing Agencies For

Consumer Confidence Definition for eCommerce in 2026

What Is Social Commerce? Your 2026 Guide to Boosting Sales

A Social Ad Campaign Playbook for eCommerce Growth

7 Best FAQ Page Examples for SaaS & eCommerce

Market Research in Fashion Industry: A Guide for Shopify

Shopify Migration Services: Expert Guide for 2026

Mastering FB Retargeting Ads for Shopify in 2026
What Is Omnichannel Ecommerce

Master Your Shopify Plus Migration: The 2026 Guide
Shopify Integration Services: A Merchant's 2026 Guide

Shopify Collection Description: A Guide to SEO & Sales

Shopify Plus Contact: Reach Sales & Support Effectively

Top Luxury Shopify Stores: Design & UX Strategies
How to Improve Customer Experience: A Shopify Roadmap

Creative Facebook Ads: 10 Examples for Shopify Brands


newsletter in your inbox