

At an average ecommerce conversion rate of roughly 1.81% to 2.58%, many stores lose more than 97% of visitors without a purchase. That's why the answer to “why is conversion rate optimization important” isn't “because a different button color might perform better.” CRO determines whether the traffic you already paid for produces profitable orders, acceptable acquisition costs, and enough contribution margin to fund the next campaign.
For a founder running paid acquisition, the central question is marginal return. Should the next optimization dollar go to the product detail page, cart, checkout, mobile experience, or post-purchase journey? The answer depends on where qualified intent is leaking, how much an order is worth, and whether the change can improve revenue without demanding an equivalent increase in media spend.
The Baseline Numbers That Make CRO a Strategic Lever
Conversion rate is calculated as conversions divided by total visitors, multiplied by 100, a definition reflected in Baymard's ecommerce conversion guidance. With average ecommerce conversion rates commonly reported around 1.81% to 2.58%, and a frequently cited “good” rate closer to 4.8%, the percentage itself becomes a commercial control variable rather than a cosmetic website metric.
Suppose your paid traffic, click costs, and landing-page volume stay unchanged. Moving from 2% to 4% means twice as many orders from the same visit base. That can reduce effective CAC because the same acquisition cost is spread across more customers. Revenue impact then depends on AOV, gross margin, repeat purchase behavior, refunds, and fulfillment costs. CRO doesn't create profitable economics automatically, but it exposes whether the existing economics have enough room to scale.
A useful operating view is:
Revenue = sessions × conversion rate × AOV
Then connect it to acquisition:
CAC = acquisition spend ÷ new customers
For blended efficiency, track MER, or total revenue divided by total marketing spend, alongside contribution margin. A higher CVR can improve MER, but a discount-led conversion lift may reduce AOV or margin. That's why founders should judge experiments against profit-sensitive metrics, not orders alone.
What the baseline tells you
A store exceeding 3.2% can sit in the top 20% of digital storefront performers according to the benchmark summary cited above, while many other stores remain below that level. The practical implication isn't that every brand should chase one universal target. Traffic intent varies. Branded search, prospecting social, affiliates, email, and direct traffic won't carry the same purchase probability.
The more useful question is: where does one additional conversion produce the highest marginal contribution? A product page with low-intent discovery traffic may have a larger visible audience but weaker economics than a checkout step with fewer users and much stronger buying intent.
| Baseline CVR | CVR After Optimization | Revenue at $50K Ad Spend | Blended CAC | Contribution Margin Lift |
|---|---|---|---|---|
| 2% | 3% | Depends on traffic cost and AOV | Lower than baseline | Depends on AOV and margin |
| 2% | 4% | Approximately double the order output if traffic and AOV remain constant | Approximately half the acquisition cost per order | Depends on contribution economics |
| 2.58% | 4.8% | More orders from the same paid traffic | Lower effective CAC | Depends on margin, refunds, and retention |
The table shows why a forecast should never stop at “conversion rate increased.” Before approving a test, define the affected funnel stage, expected order value, contribution margin, and guardrail metrics. Use ecommerce conversion rate benchmarks from ECORN to frame the baseline, but use your own segmented data to decide where to invest.
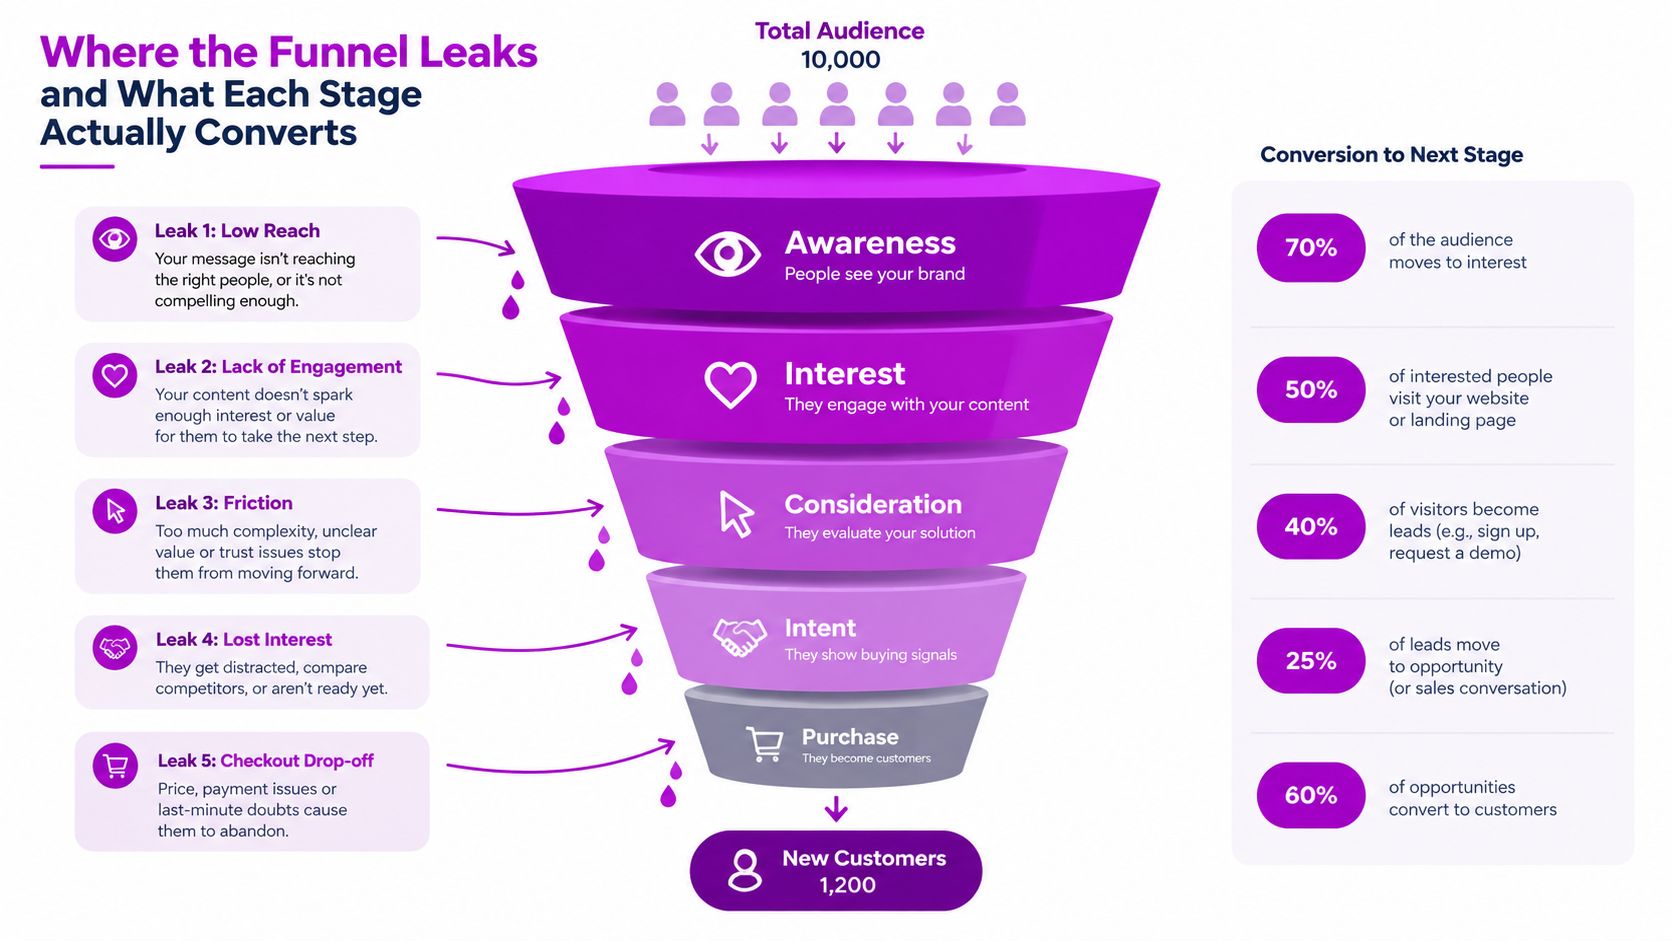
Where the Funnel Leaks and What Each Stage Actually Converts
A blended sitewide CVR hides the location and cost of failure. Break the journey into landing, product discovery, add to cart, cart, checkout, purchase, and repeat purchase, then assign each stage one primary KPI and one diagnostic question.
Landing and product discovery
At the homepage or campaign landing page, watch engaged sessions, bounce behavior, and progression to a product view. The question is whether the page confirms the promise made by the ad quickly enough. A prospecting visitor may need education, while a branded-search visitor may need a direct route to the relevant product or collection.
On the product page, track add-to-cart rate, variant selection, image interaction, review engagement, and scroll depth. A low add-to-cart rate can reflect weak value communication, unclear delivery terms, insufficient trust, poor merchandising, or a mismatch between ad promise and product reality. Don't assume the CTA is the problem before checking whether visitors understand price, fit, availability, shipping, and returns.
Cart and checkout
Cart abandonment sits at roughly 70.19% to 70.22% in Baymard's benchmark, meaning the largest loss often occurs after a shopper has already demonstrated intent. The correct diagnostic question is not “how do we get more people to add an item?” It's “what changes after intent is established that makes completion unattractive or difficult?”
Common causes include unexpected shipping charges, unavailable payment methods, mandatory account creation, weak error handling, and form friction. A founder evaluating outbound demand generation may also benefit from separating ecommerce behavior from sales-led prospecting, with resources such as hire cold callers serving a different funnel and qualification model.
Purchase and repeat behavior
Checkout completion should be measured by device, payment method, browser, and error state. A technical failure affecting one payment option can have a larger commercial impact than a copy issue on a high-traffic page because it blocks shoppers who are already close to purchase.
Post-purchase CRO tracks second-order rate, replenishment timing, returns, support contacts, and email engagement. It isn't a substitute for fixing checkout, but it changes the economics of the first order. If a customer reliably returns, the allowable first-order acquisition cost may be higher. Review the full path in conversion funnel analysis from ECORN, rather than optimizing isolated page metrics.
How CRO Lowers Customer Acquisition Cost and Lifts Revenue
CRO lowers effective CAC because acquisition spend doesn't change when more visitors become customers. If a store converts at 2% and improves to 4%, identical paid traffic can produce twice the order volume, assuming traffic quality, AOV, and attribution remain stable. The often-discussed shift from 2% to 4% is therefore more than a conversion story. It changes the denominator in the CAC equation.
The calculation is straightforward. If spend stays fixed, customers increase as CVR increases, so spend per customer falls. Revenue also rises when AOV remains constant. Contribution margin, however, requires a more careful view because discounts, shipping subsidies, returns, payment fees, and product mix can offset the apparent gain.
Same traffic, different commercial outcomes
| Conversion Rate | Orders per Month | Revenue | Effective CAC | CAC Reduction vs. Baseline |
|---|---|---|---|---|
| 2% | Depends on monthly sessions | Sessions × 2% × AOV | Spend ÷ orders | Baseline |
| 3% | Depends on monthly sessions | Sessions × 3% × AOV | Spend ÷ orders | Lower than baseline |
| 4% | Depends on monthly sessions | Sessions × 4% × AOV | Spend ÷ orders | Approximately half of the 2% baseline, if all else holds |
The stage where the lift occurs matters. A 0.5-point improvement before product-market fit or before a shopper has seen price may require a broad behavioral change. A 0.5-point improvement at checkout affects a smaller but more qualified group. The checkout opportunity is especially material because Baymard reports that the average large ecommerce site could increase conversion by 35.26% through checkout-design improvements alone according to its benchmark. That figure is an identified opportunity, not a guaranteed result for every store.
Practical rule: Rank tests by expected incremental contribution, not by page traffic alone.
A high-AOV store may prioritize payment presentation and delivery certainty because one recovered order carries substantial value. A lower-AOV, repeat-purchase brand may prioritize subscription clarity, replenishment flows, and first-order friction. In both cases, the next optimization dollar should go where qualified intent and contribution margin intersect.
CRO also has a testing constraint. The empirical ecommerce A/B-test meta-analysis at Alex Miller's research project found that 20% of tests generated 81% of total conversion uplift. Most tests won't transform the business. A disciplined pipeline matters because a small number of strong wins can finance further learning, while a sequence of broad redesigns makes it difficult to identify what changed performance.
Mobile, Checkout, and the Friction Surfaces That Decide Outcomes
Device mix changes the value of each optimization. Independent benchmark summaries report mobile conversion around 1.8%, compared with desktop conversion around 3.9% to 4.14%. One benchmark set also reports desktop AOV around $230.20, versus $145.49 on mobile, although the exact gap varies by category, traffic source, and customer mix. The operational conclusion is clear: mobile shouldn't be treated as a smaller desktop layout.
Compare the device journey, not just the device rate
| Device | Product Page CR | Cart Abandonment | Checkout Abandonment |
|---|---|---|---|
| Mobile | Often lower than desktop, with benchmark conversion around 1.8% | About 70.2% across ecommerce benchmarks | Diagnose by form errors, payment selection, and load behavior |
| Desktop | Around 3.9% to 4.14% in cited benchmark summaries | About 70.2% across ecommerce benchmarks | Diagnose by shipping presentation, trust, and payment completion |
These figures are directional benchmarks, not a forecast for an individual store. Mobile shoppers may arrive from lower-intent social placements, use slower connections, or encounter a product page with oversized media and buried purchase information. Desktop visitors may have more room to compare products, review delivery terms, and complete forms.
Why checkout deserves priority
Checkout defects compound on small screens. A required account, unclear shipping total, awkward address form, missing wallet option, or poorly displayed error can turn purchase intent into abandonment. Baymard's checkout benchmark frames this as a design opportunity rather than a traffic problem, because improving the final step can recover demand the brand has already paid to acquire.
Start with session segmentation. Compare mobile and desktop abandonment at the same checkout step, then separate payment errors from hesitation. If mobile users reach payment but fail there, redesigning the product page first may produce little marginal return. If they never reach cart because delivery information is absent, the product page becomes the earlier bottleneck.
The trade-off is measurement discipline. A mobile redesign can improve usability while lowering AOV if it pushes more low-value products, or raise purchases while increasing returns if product expectations become less clear. Monitor CVR, AOV, contribution margin, payment success, and returns together. The winning experience is the one that creates more valuable completed orders, not merely more taps.
A/B Testing, Personalization, and the New Optimization Stack
CRO no longer needs to mean choosing between A/B testing and behavioral analysis. The strongest operating model treats them as connected layers. Behavioral analytics identifies where visitors hesitate, experimentation tests a proposed fix, and personalization adapts a validated message or experience to a relevant audience.
The evidence for a disciplined testing pipeline is unusually concentrated. The ecommerce A/B-test meta-analysis cited earlier found that 20% of tests produced 81% of total conversion uplift. That distribution makes indiscriminate redesigns risky. Teams need enough high-quality hypotheses to discover the few changes that matter, but they also need controls that protect margin, AOV, and customer quality.
What each layer contributes
- Behavioral analytics: Heatmaps, session replay, funnel diagnostics, and form analysis reveal dead clicks, repeated errors, hesitation, and stage-specific exits. These tools explain what aggregate conversion data cannot.
- A/B testing: Controlled variants help distinguish a real improvement from seasonal mix, channel changes, or random fluctuation. Testing is strongest when the hypothesis comes from observed behavior.
- Personalization: Relevant content can respond to signals such as campaign source, returning status, product interest, or geography. It can tailor the experience, but it also raises governance, privacy, and operational complexity.
Recent coverage reports that AI-driven personalization increased conversion rates by 28% in one portfolio, behavioral analytics replaced A/B testing as the primary method for 68% of high-performing stores, and mobile-first product-page redesigns produced 14% to 22% conversion improvements on mobile sessions. These are source-specific findings from Build Grow Scale's 2026 recap, not universal benchmarks.
The strategic shift is important. A/B testing asks which experience performs better under a defined allocation. Personalization asks whether different visitors should receive different experiences in the first place. Use the latter carefully. If segmentation is weak, personalization can multiply noise and make attribution harder. If the behavior is clear and the segment has enough value, it can turn a validated insight into a more relevant buying journey.
Why CRO Matters More as Ad Costs Climb
Paid acquisition makes every visit an economic liability until the visitor converts or creates future value. When media becomes more expensive, the store has fewer opportunities to absorb friction. CRO therefore functions as a margin and cash-flow lever, not a finishing layer applied after acquisition is solved.
The relationship is easiest to see with fixed traffic. At a 2% conversion rate, a given session base produces one order volume. At 3%, the same sessions produce 50% more conversions, provided traffic quality and order economics remain stable. The source summary for this topic also notes that improving conversion from 2% to 4% can effectively halve customer acquisition cost, because the same acquisition spend generates twice the customers.
Revenue changes when traffic stays fixed
| Conversion Rate | $30 AOV | $50 AOV | $80 AOV |
|---|---|---|---|
| 2% | Sessions × 2% × $30 | Sessions × 2% × $50 | Sessions × 2% × $80 |
| 3% | Sessions × 3% × $30 | Sessions × 3% × $50 | Sessions × 3% × $80 |
| 4% | Sessions × 4% × $30 | Sessions × 4% × $50 | Sessions × 4% × $80 |
The table deliberately leaves session volume open. Without a verified traffic count, a dollar forecast would be invented. The business logic still holds: each additional conversion creates more revenue at the prevailing AOV, while the acquisition spend remains fixed.
For a brand with thin contribution margin, an unprofitable discount can create a misleading CRO win. A free-shipping threshold may increase CVR and AOV while reducing contribution per order. A faster checkout may improve completed purchases but expose inventory or fulfillment constraints. Founders should set guardrails before launch, including margin after fulfillment, refund rate, payment success, and customer support contacts.
The source material also cites an example where a 1% absolute lift on a site doing $1 million in monthly revenue could add about $120,000 annually, but that illustration depends on its stated business conditions and shouldn't be generalized. The durable conclusion is simpler: when paid traffic is already flowing, improving the percentage that converts can increase revenue without buying equivalent additional reach.
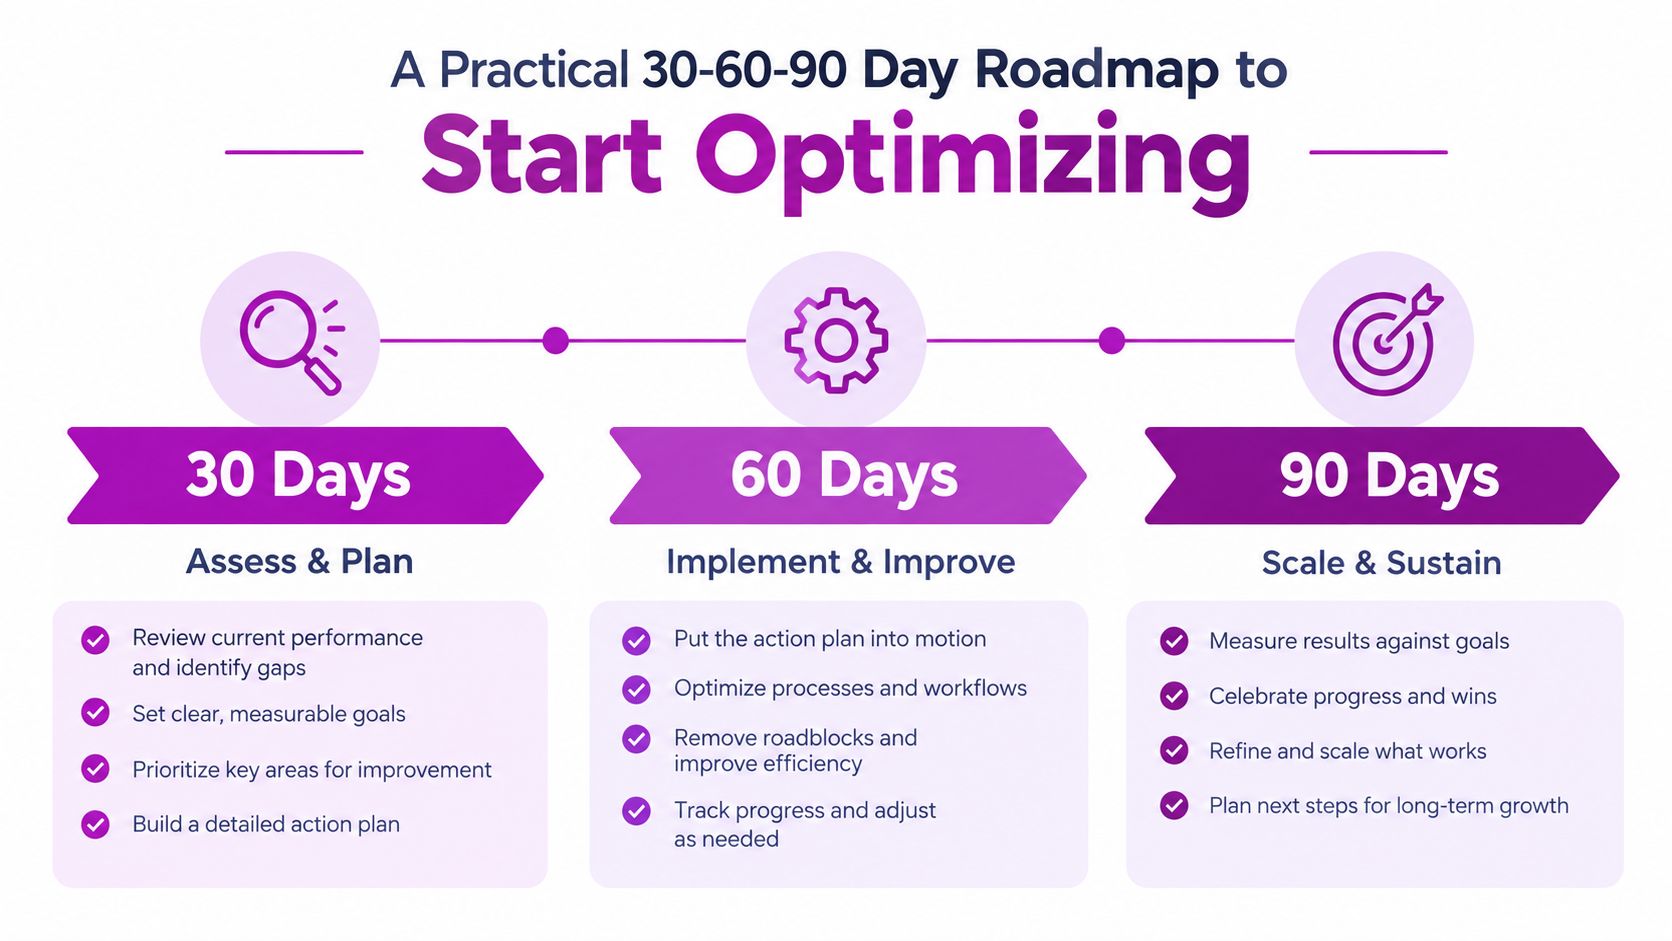
A Practical 30-60-90 Day Roadmap to Start Optimizing
A CRO program can start with internal ownership, provided the team protects measurement quality and doesn't confuse activity with learning. The first quarter should produce a ranked opportunity map, validated experiments, and a repeatable review rhythm.
Days 1 to 30, establish the evidence
Begin with analytics hardening. Confirm that product views, add-to-cart events, checkout starts, payment attempts, purchases, refunds, and device attributes are recorded consistently. Reconcile platform totals with analytics rather than treating either system as perfect.
Next, build a funnel by source, device, new versus returning visitor, product category, and checkout step. Assign an owner from ecommerce, analytics, engineering, and merchandising. Watch recordings or review behavioral tools for the highest-value drop-offs, then document each finding as a hypothesis.
Rank the backlog using three filters:
- Revenue exposure: How much qualified traffic reaches the affected stage?
- Commercial value: What AOV and contribution margin does the stage influence?
- Testability: Can the team isolate the change without altering several other variables?
Don't invent a sample-size threshold. Set the threshold before the test based on baseline CVR, minimum detectable effect, traffic volume, and acceptable false-positive risk. If the store lacks enough order volume for a clean test, prioritize technical fixes, qualitative research, and staged rollouts instead of declaring winners from noisy data.
Days 31 to 60, test the expensive leaks
Start with checkout if the data shows high-intent abandonment. Test guest checkout, field reduction, error clarity, delivery-cost visibility, payment presentation, or reassurance near the final action. Keep the control intact, define one primary success metric, and add guardrails for AOV, margin, refunds, and payment failures.
Then audit the highest-traffic product pages. Compare ad promise with page promise, inspect variant selection, check mobile media behavior, and review whether shipping, returns, reviews, and availability appear before hesitation begins. Merchandising should own product relevance, while design and engineering own implementation quality.
ECORN is one option for Shopify brands that need conversion research, checkout optimization, product-page testing, and implementation support. The relevant service choice depends on whether the constraint is diagnosis, experimentation, development capacity, or strategic prioritization.
Days 61 to 90, institutionalize the loop
Create a weekly review that records tests launched, tests completed, evidence collected, decisions made, and follow-up actions. Roll successful changes into the storefront only after checking segment performance and commercial guardrails. Treat negative results as evidence about the audience, not as a reason to abandon testing.
Funded brands can then evaluate personalization or AI-assisted recommendations, but only after the behavioral data and event taxonomy are reliable. The program should move from “what should we change?” to “which segment, stage, and economic outcome justify the next change?”
ECORN helps Shopify brands investigate conversion leaks, improve checkout and product-page experiences, and support CRO implementation through flexible ecommerce services. If you want to identify the funnel stage with the highest marginal return, visit ECORN and discuss an audit or focused optimization project.


Ecommerce Loyalty Program Software How to Choose and Launch
Shopify Plans Comparison for Every Business Stage
How to Improve User Experience for eCommerce Growth
Shopify Checkout Optimization That Converts More
Shopify Inventory Sync: A Practical Setup Guide
Shopify App Integration Playbook That Scales
Shopify CMS Integration: Your 2026 Guide to Options
Shopify Store Audit: Find Hidden Conversion Leaks
Shopify Plus Experts: How to Hire the Right Team
Chargeback Protection Shopify: A Practical 2026 Guide
8 Examples of Conversion Rate Optimization
How to Conversion Rate Optimization for Shopify Stores

Shopify Design Essentials Every Store Owner Needs
Ecommerce Terms of Service: How to Draft and Implement
How to Implement Structured Data for Ecommerce in 2026

SEO App Mobile: Shopify Store Optimization Guide
Shopify Plus Support: What It Includes and How to Choose

Google Ads for Shopify: The Complete 2026 Playbook

Shopify New York: How to Find and Hire the Right Agency
Google Search Console for Shopify: The Complete Setup

First Party Data Collection for eCommerce Growth
FAQ Online Store Guide: Build and Measure It Right
Do FB Ads Work for eCommerce in 2026?
One Page Checkout for Shopify: Design and Implementation
Shopify GraphQL vs REST: The 2026 Developer Decision
Shopify Ecommerce Consulting: Strategy, Pricing &

Are Reddit Ads Worth It for eCommerce Brands

Shopify Title and Meta Description: A Practical 2026 Guide

Product Video Best Practices for Shopify Brands
Real-Time Inventory Management: A 2026 Guide

AI Chatbot Integration for Shopify Stores
Affiliate Program Management: A Shopify Guide
10 Best Performance Monitoring Tools for Shopify in 2026

Digital Asset Management for eCommerce Brands in 2026
Every Type of Facebook Ads Explained for eCommerce Growth
Product Information Management Explained for Shopify Brands
Support Ticket System: A Guide for Shopify Stores

10 Best Customer Service Tools for Shopify in 2026

Can I Start a Business with No Money? a 2026 Blueprint

What Sells Good on Etsy: Best Niches for 2026

Shopify Add to Cart Button: A Practical 2026 Guide

Customer Feedback Automation: A Practical eCommerce Guide
Critical Rendering Path: A Guide for Shopify Stores

How to Promote on TikTok for eCommerce in 2026

B2B eCommerce Consulting That Drives Real Revenue
10 Best Practices for Site Navigation in 2026
Return vs Refund for Shopify Stores: A Practical Guide
What Is Customer Lifetime Value and Why It Matters
What Is Voice of Customer Research for eCommerce

SMS Marketing for Ecommerce That Actually Converts

Master How to Improve Email Deliverability in 2026

Top 7 eCommerce Partners NYC for Shopify Brands in 2026

Machine Learning for Ecommerce: Boost Your Shopify Store

Beauty Market Research: Your 2026 Growth Guide

Shopify International Expansion: A 2026 Roadmap
What Does CRO Stand for in Business: Understanding CRO

Shopify Visual Merchandising: A Playbook for Higher Sales

Shopify Landing Page Design: Master Conversion in 2026
10 Best AI SEO Optimization Tools for Shopify in 2026

Agentic AI for Ecommerce: Boost Your Sales in 2026
Mastering Email Marketing Data for eCommerce Growth

Conversion Rate Optimisation Australia: Boost Your Sales
Conversion Rate Optimization AI: Your Shopify Store Guide

10 Product Bundling Strategies for Shopify in 2026

How to Increase Customer Lifetime Value: A Shopify Playbook
AI Customer Service Automation: Shopify Guide 2026

Clean Website Design: A Shopify Conversion Playbook

Omnichannel Retail Strategy: A Shopify Playbook
Product Data Enrichment: A Guide for Shopify Brands

Instagram Shopping Features a Guide for Shopify Stores
What Is Revenue Optimization: A Holistic RevOps Guide
Benefits of Conversion Rate Optimization: Boost Your
WordPress to Shopify Migration: Your 2026 Seamless Switch
Boost Sales: Ecommerce Payment Processing Guide 2026
Unified Commerce Platform: Benefits, KPIs & Shopify Guide
How to Reduce Bounce Rate eCommerce: Your 2026 Guide
Shopify API Integration: A Practical End-to-End Guide

How to Implement Data Governance: A 2026 Guide
Shopify Store Development Cost: A 2026 Breakdown
What Is Server Side Tracking: The Shopify Guide 2026
Marketing Automation Workflows: A Shopify Guide for 2026

Shopify: How to Reduce Technical Debt

Shopify UX Design Change: A Playbook for Growth
User Generated Content Strategy: Shopify Playbook

Shopify Pause and Build Plan Cost: A Complete 2026 Guide

Compare at Price on Shopify: A Complete Guide for 2026

Where Can I Sell My Prints? 10 Best Platforms for 2026
Shopify Order Management System: The Ultimate Guide 2026
What Is Marketing Attribution? an eCommerce Guide for 2026

10 Best Black Friday Sales Sheets for 2026

Discover the Top Social Media Marketing Agencies For
Consumer Confidence Definition for eCommerce in 2026
What Is Social Commerce? Your 2026 Guide to Boosting Sales

A Social Ad Campaign Playbook for eCommerce Growth

7 Best FAQ Page Examples for SaaS & eCommerce

Market Research in Fashion Industry: A Guide for Shopify

Shopify Migration Services: Expert Guide for 2026

Mastering FB Retargeting Ads for Shopify in 2026
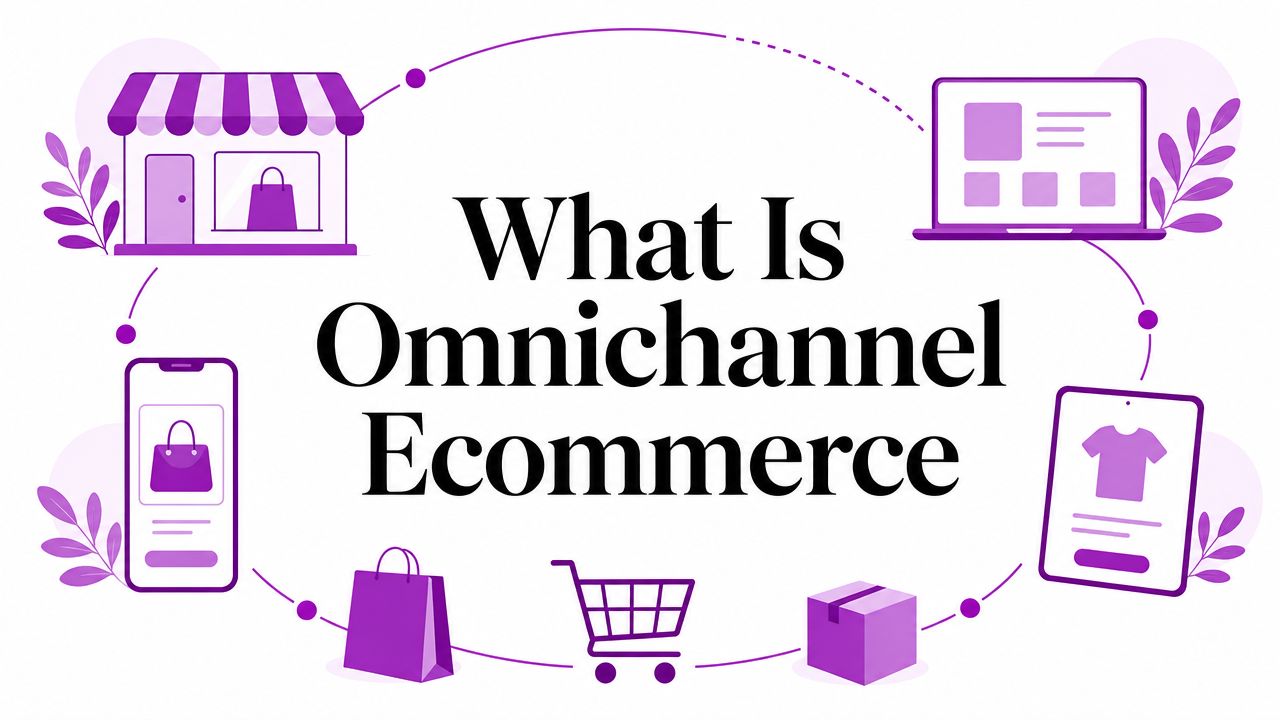
What Is Omnichannel Ecommerce

Master Your Shopify Plus Migration: The 2026 Guide


newsletter in your inbox