

Go Beyond Guesswork. Master the Stats That Fuel Shopify Growth.
You're collecting data in Shopify Analytics, GA4, and maybe a heatmapping tool like Hotjar or Microsoft Clarity. You run A/B tests on PDP layouts, price framing, or cart messaging, then stare at the results wondering whether the lift is real or just noise. A small conversion bump looks promising, but you're still left with the hard questions. Is it significant, is the sample large enough, and should you ship the change across the store?
That's the gap most operators run into. Having dashboards isn't the same as understanding uncertainty, test validity, or when a metric is lying to you. The good news is you don't need a graduate degree to fix that. You need a strong statistics YouTube channel that teaches the concepts behind experimentation, forecasting, segmentation, and interpretation in a way you can apply inside Shopify.
YouTube is built for this kind of learning at scale. It reached 2.74 billion monthly active users, generated $36.1 billion in revenue, and Shorts averaged 70 billion views per day in 2024 according to Business of Apps. For eCommerce teams, that matters because the best educational channels aren't buried in a niche corner of the web. They sit on a platform where deep tutorials, short explainers, and repeat learning habits already exist.
1. StatQuest with Josh Starmer
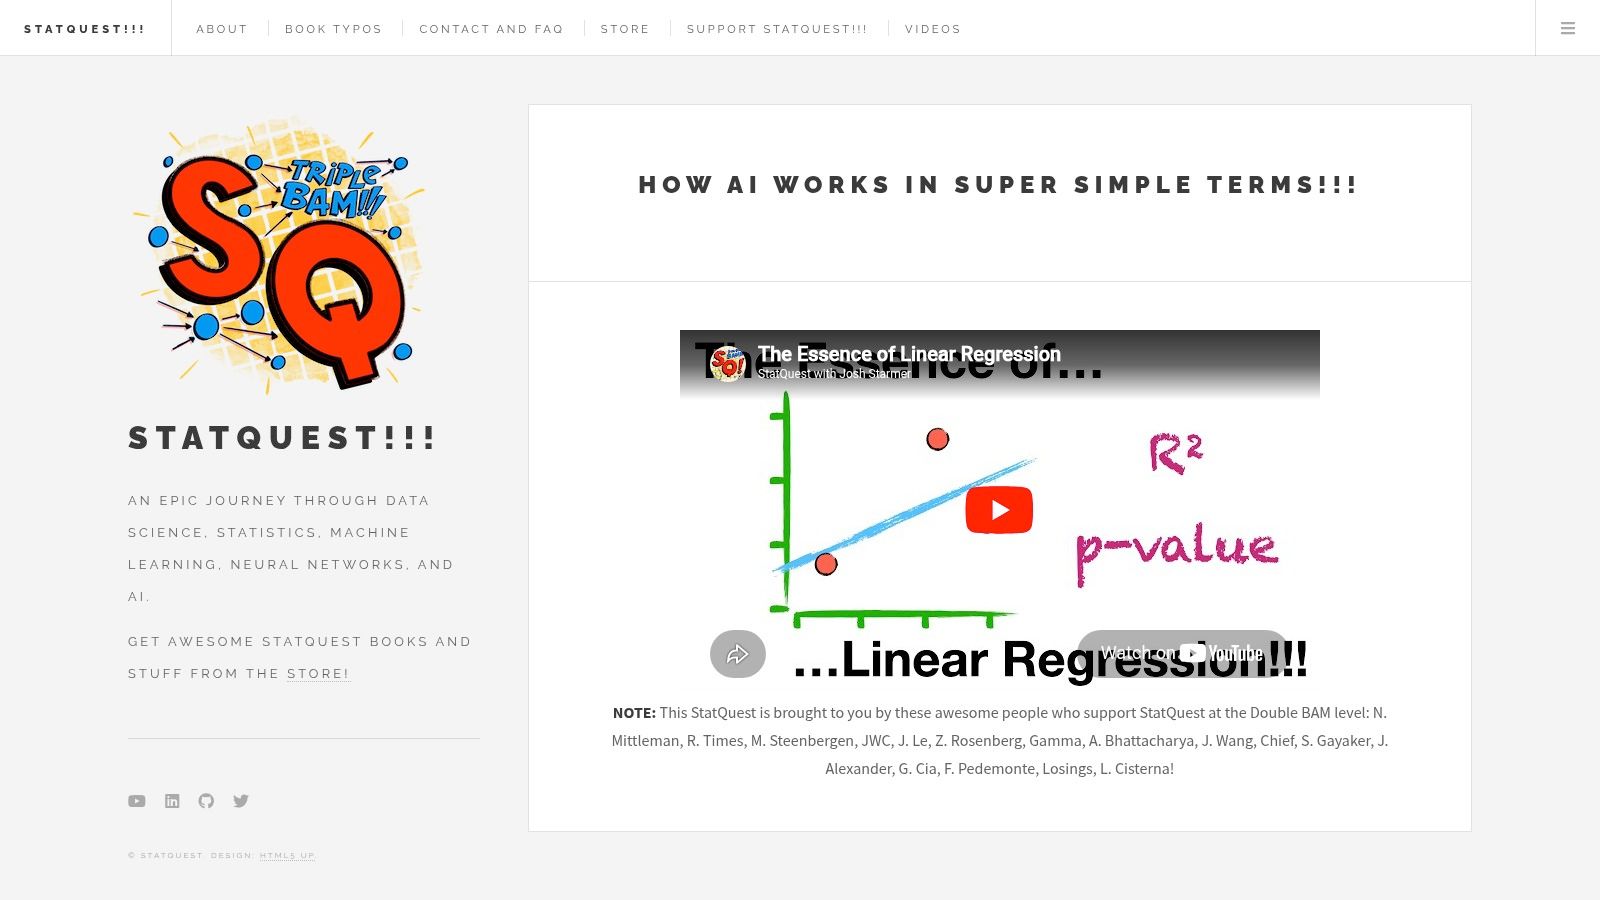
If your CRO team keeps throwing around terms like p-values, logistic regression, overfitting, or confidence intervals, StatQuest is the cleanest place to get unstuck. The teaching style is direct, memorable, and much better than the usual stats lecture format that loses non-analysts in the first ten minutes.
For Shopify brands, the value is practical. You can use StatQuest to understand what your testing tool is doing when it labels a result as likely to win, and you can build better judgment around segmentation, propensity modeling, and forecasting repeat purchase behavior. Visit StatQuest if you want a statistics YouTube channel that makes technical topics feel usable instead of intimidating.
Where it helps most in eCommerce
The strongest fit is experimentation and model interpretation. If your team is deciding whether to trust a conversion-rate lift on a collection page or whether a returning-customer model is separating useful signals from junk, this channel gives you the intuition layer that many dashboard users never build.
Practical rule: Use StatQuest when the team needs to understand why a method works, not just how to click through a tool.
A few trade-offs matter:
- Best for intuition-first learning: It's excellent for grasping hypothesis testing, regression, and classification without drowning in notation.
- Strong support for experimentation teams: Concepts map well to A/B testing, funnel analysis, and retention modeling.
- Less useful for platform setup: It won't show you how to configure GA4 events, Shopify reports, or a testing tool UI.
This is the channel I'd put in front of a growth lead, CRO manager, or analyst who has to explain test outcomes to a founder. It won't replace implementation training, but it will make your team much harder to fool with bad reads on data.
2. Khan Academy
Khan Academy is the safest recommendation when someone on the team needs fundamentals, not shortcuts. A lot of eCommerce brands have one or two data-comfortable people and everyone else operates on instinct, screenshots, and half-remembered definitions from old marketing courses. That creates friction fast.
Khan Academy fixes the baseline. The Khan Academy platform gives you a structured path through statistics and probability with practice built in, which makes it useful for onboarding marketers, operators, and junior analysts who need to stop guessing their way through reports.
Best use inside a Shopify team
This isn't the channel for advanced Bayesian testing or causal modeling. It's the channel for building shared language across the company so people stop confusing variance with error and stop overreacting to small swings in conversion rate.
That matters more than many teams realize. You can't build a serious testing culture if the merchandiser, paid media lead, and founder all interpret evidence differently. Stronger fundamentals also make it easier to apply real data-driven decision-making examples for eCommerce teams without turning every meeting into a stats seminar.
- Good for onboarding: New hires can move from zero to competent faster with a clear sequence.
- Good for standardization: Everyone learns the same definitions and core mechanics.
- Weak on direct business framing: You'll still need to translate textbook examples into AOV, CVR, CAC, and LTV decisions.
Teams usually don't fail because the math is impossible. They fail because nobody agrees on what the result means.
Use Khan Academy when your problem is capability spread across the team, not depth at the specialist level.
3. Crash Course Statistics

Crash Course is what I'd hand to the stakeholder who says, “I'm not a numbers person,” but still needs to make calls on budgets, landing pages, and reporting. The pace is fast, the explanations are engaging, and the series does a strong job of teaching statistical thinking instead of isolated formulas.
That distinction matters in eCommerce. Most expensive mistakes don't come from failing to calculate a metric. They come from misunderstanding sampling, bias, noisy comparisons, or false certainty in a dashboard. The Crash Course statistics page is a solid place to build that judgment.
Why operators respond well to it
The format works well for marketers, creatives, and founders who need enough fluency to challenge bad assumptions. If your reporting meetings suffer from comments like “sales were up yesterday so the new page worked,” this channel helps clean up the reasoning.
It's also a good fit for cross-functional teams because the storytelling keeps people engaged. That's a real advantage when you need buy-in from people who won't sit through traditional lecture content.
- Great for shared vocabulary: Bias, inference, distributions, and sampling become easier to discuss across teams.
- Strong for non-technical stakeholders: It reduces fear around statistics without talking down to the audience.
- Limited for hands-on implementation: You won't get software walkthroughs or analytics stack training.
One caution. If your analyst needs derivations, coding examples, or advanced experimental design, this won't go far enough. But if your business needs cleaner thinking around evidence, it does the job better than most channels aimed at general audiences.
4. JB Statistics
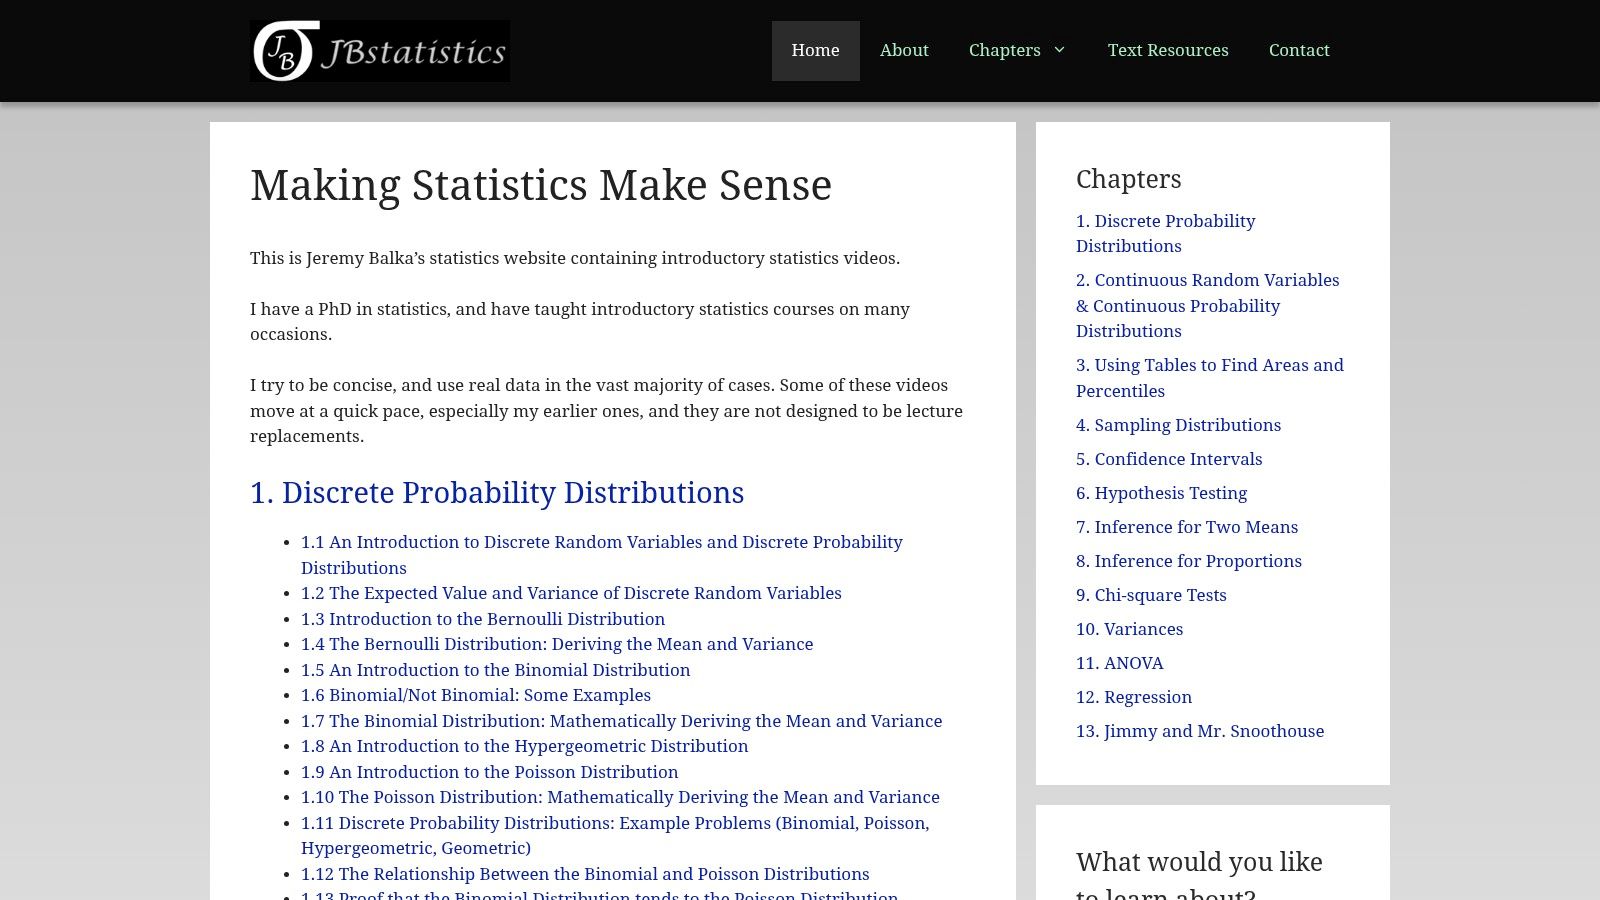
JB Statistics is for the operator who wants the classical framework taught cleanly and without theatrics. The videos are compact, organized, and methodical. That makes them useful when you need to tighten up the mechanics behind confidence intervals, hypothesis tests, ANOVA, or regression instead of just nodding along to a high-level explanation.
For Shopify teams, that's often the difference between “we ran a test” and “we ran a valid test.” You can explore the channel through JB Statistics.
Where it earns its keep
This channel is especially useful for analysts and growth managers who already know the broad ideas but want cleaner setup and interpretation. If someone on your team keeps mixing up null hypotheses, test assumptions, or the difference between statistical and business significance, JB Statistics is a strong corrective.
I like it for review work. Before launching a test on product page templates, shipping thresholds, or upsell placement, an analyst can revisit the relevant topic and make sure the method matches the question.
The wrong statistical setup can make a disciplined team look sloppy. JB Statistics helps prevent that.
- Best for compact refreshers: You can revisit a concept quickly before a report or test review.
- Strong for classical inference: Useful when your experimentation process still relies on standard frequentist methods.
- Less approachable for complete beginners: The pacing can feel brisk if someone has no baseline.
This isn't the most entertaining statistics YouTube channel on the list. It's one of the most useful when correctness matters.
5. Brandon Foltz
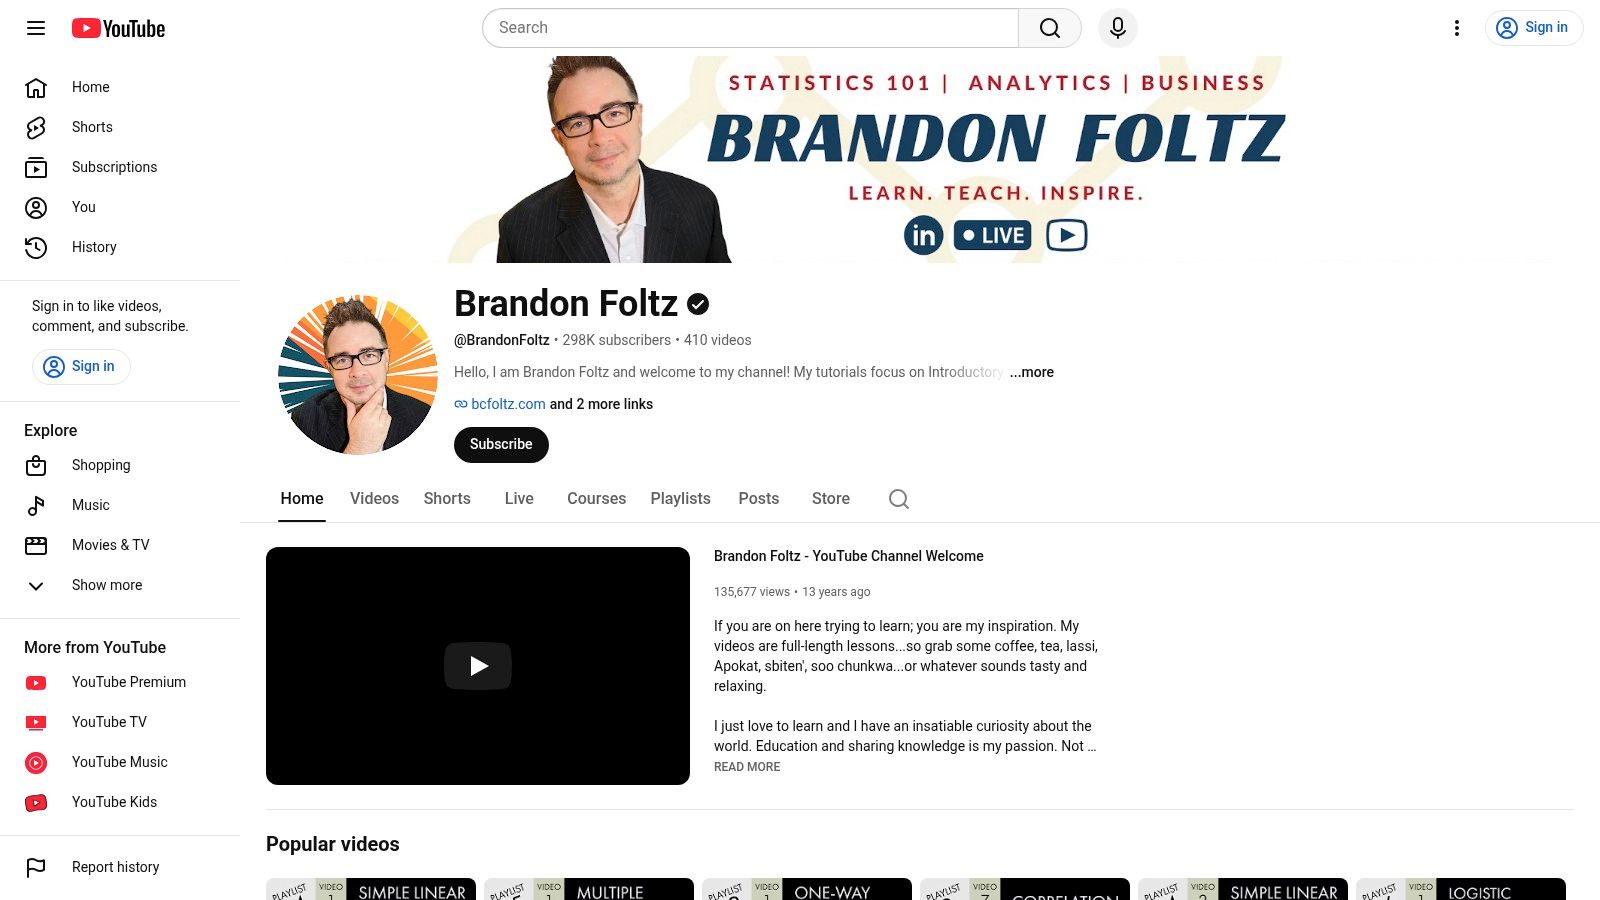
Some people don't learn a method until they watch every step. Brandon Foltz is built for that type of learner. The videos are detailed, slower, and explicit about the mechanics, which makes them helpful for team members who keep making setup errors in spreadsheets, reports, or manual analyses.
That style is more valuable in eCommerce than it sounds. A surprising amount of Shopify reporting still happens in exported CSVs, Google Sheets, or stitched-together dashboards. When someone doesn't fully understand the mechanics behind confidence intervals, regression, or hypothesis tests, they tend to trust outputs they shouldn't trust. Brandon Foltz reduces that risk. You can find the channel at Brandon Foltz on YouTube.
Best fit for spreadsheet-heavy teams
If your team still uses Excel or Sheets heavily for cohort reviews, merch analysis, and promotional readouts, these walk-throughs help. They reinforce process, not just answers. That's useful when a retention analyst or marketing manager needs to understand exactly how a result was built.
- Strong for worked examples: Good for people who need repetition and method, not summary.
- Useful for mechanics: It helps reduce avoidable mistakes in manual calculations and report building.
- Less modern in feel: If you want polished production or contemporary analytics tooling, the style can feel traditional.
This is the channel for discipline. Not speed, not inspiration, discipline. And in CRO work, discipline is what keeps false wins out of your roadmap.
6. ZedStatistics
ZedStatistics works well as a second teacher. When someone on the team didn't quite click with a concept from another channel, this one often lands because the visual framing and analogies are strong. That makes it useful for mixed teams where analysts, lifecycle marketers, and operators all need a workable understanding of inference and uncertainty.
The ZedStatistics website organizes the material cleanly, which helps if you want to dip into a topic hub rather than follow a full sequential course.
Best as a complement, not a replacement
I wouldn't make this the only statistics YouTube channel in your stack. I would absolutely use it alongside something more structured like StatQuest or JB Statistics. The benefit is conceptual reinforcement. Teams remember methods better when they hear them explained in different ways.
YouTube discovery itself is recommendation-driven. IntoTheMinds reports that 70% of YouTube traffic comes from recommendation algorithms, while the median video has only 35 views and 93% of videos have fewer than 1,000 views. For you as a learner, that means popular educational channels with clear packaging tend to surface repeatedly, and it's worth using that to your advantage by building a small rotation of trusted instructors instead of wandering through random one-off explainers.
- Strong for concept reinforcement: Great when the first explanation didn't stick.
- Good for cross-functional learning: The visual style works for non-specialists.
- Limited depth on tooling: You won't get much help on implementation inside analytics software.
If your team needs the “why” behind the math before they'll trust the method, ZedStatistics is a strong add.
7. Richard McElreath
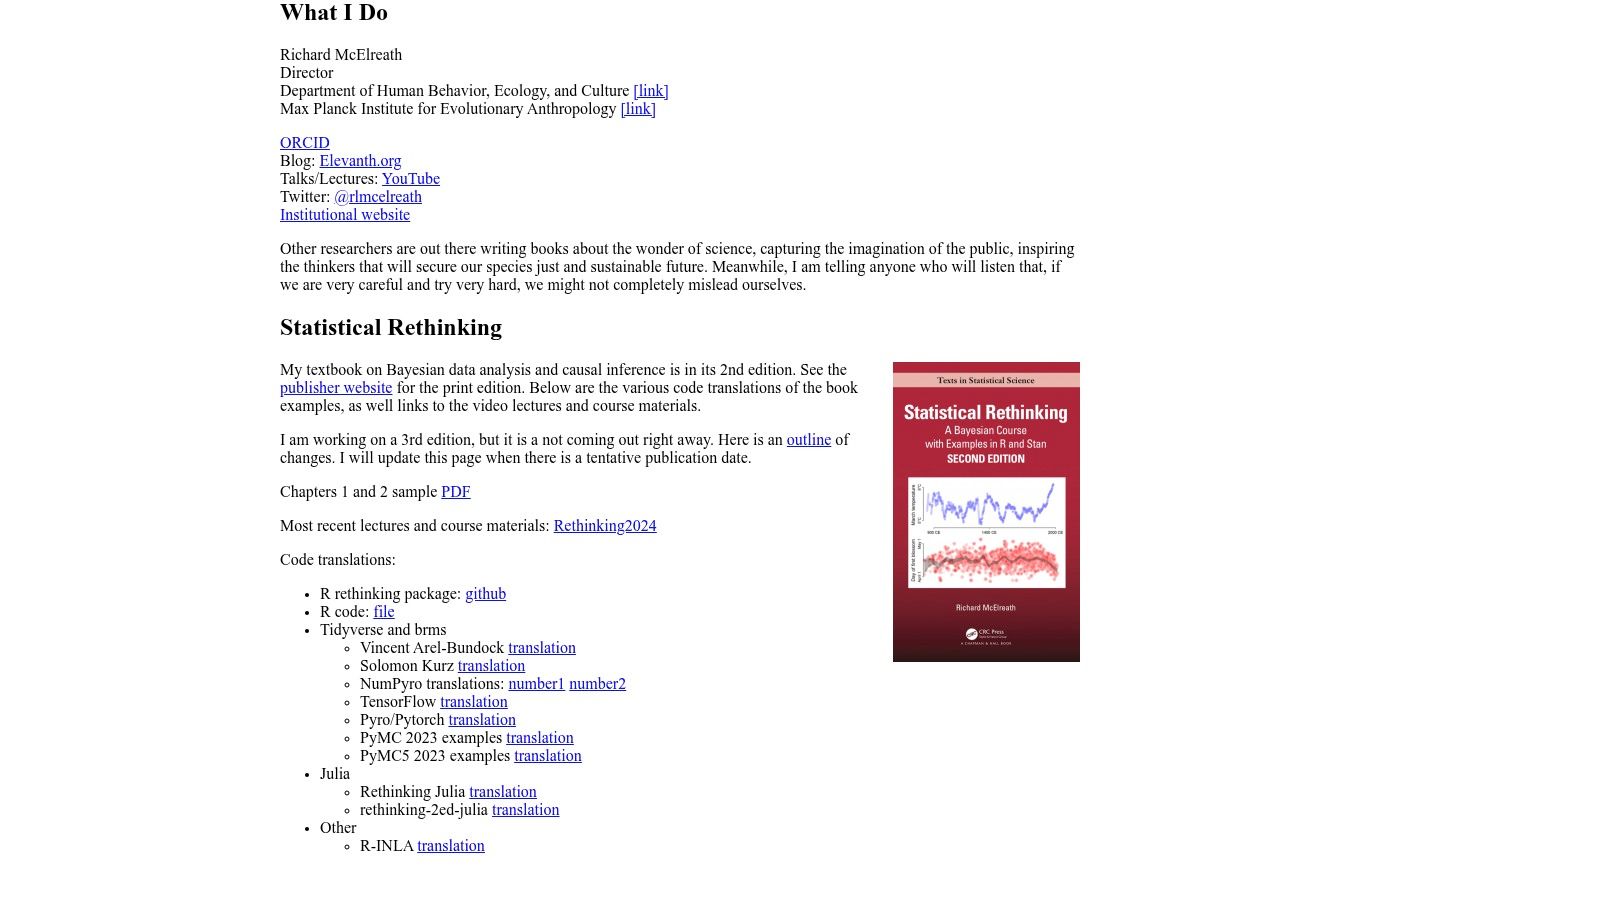
Richard McElreath is the advanced option on this list. If your team is moving beyond basic A/B reads and wants better decision-making under uncertainty, Bayesian thinking becomes useful fast. That's especially true when sample sizes are messy, segments are uneven, and executives still need a call on whether to roll out a change.
The lectures behind Richard McElreath's Statistical Rethinking resources are rigorous. They're not built for casual viewing. They are built for people who want to understand priors, posteriors, hierarchical models, and model-based reasoning at a much deeper level.
Where Bayesian thinking pays off for Shopify brands
This matters most for brands with fragmented data. If you're testing by device, market, or customer segment, classical methods can become awkward when every slice is small and noisy. Hierarchical thinking can help you pool information more intelligently instead of treating each subgroup like an isolated universe.
That's also relevant outside experimentation. Inventory planning, repeat purchase forecasting, and merchandising decisions often benefit from stronger probabilistic reasoning. Teams exploring more advanced demand forecasting techniques for eCommerce operations will find this style of thinking especially useful.
Don't start here if your team still argues about what a confidence interval is. Start here when your fundamentals are stable and your questions are getting harder.
One more reason this channel matters now. YouTube remains learning-oriented. Cross River Therapy cites datasets indicating YouTube has 2.5+ billion monthly active users, over 1 billion hours watched daily, more than 70% of users watch to learn something new, and the average viewing session is about 40 minutes. That supports long-form, demanding educational content of the kind McElreath produces.
- Best for advanced teams: Ideal for analysts and experimentation leads, not beginners.
- Strong for uncertainty and model building: Useful when simple winner-loser test framing is no longer enough.
- Steep learning curve: Comfort with R and math helps a lot.
Top 7 Statistics YouTube Channels Comparison
| Resource | Implementation complexity 🔄 | Resources & tooling ⚡ | Expected outcomes 📊 | Ideal use cases 💡 | Key advantages ⭐ |
|---|---|---|---|---|---|
| StatQuest with Josh Starmer | Low–Medium, intuition-first, minimal proofs | Low, video lessons, optional book/patreon | Strong conceptual mastery; improved model interpretation | Analysts & CRO teams needing intuition and visuals | Clear visuals/analogies; frequent, well-maintained content |
| Khan Academy (Statistics & Probability) | Low, structured from basics to AP level | Very low, free platform with practice exercises | Standardized foundational stats knowledge and mastery checks | Ramping beginners; standardizing team baseline knowledge | Comprehensive curriculum; interactive practice problems |
| Crash Course Statistics | Low, intuition and storytelling, light on math | Very low, short video series, no software | Shared vocabulary and practical interpretation for non-technical teams | Marketers, operators, stakeholders needing quick overview | Engaging, fast way to build comfort with core ideas |
| JB Statistics (Jeremy Balka) | Medium, concise, syllabus-like with clear derivations | Low, focused videos; limited tooling demos | Practical competence in classical parametric testing and interpretation | Analysts needing compact, correct procedure refreshers | Clear, compact lectures that fit busy schedules |
| Brandon Foltz | Medium, algebraic, step-by-step problem solving | Low, long-form video tutorials and practice problems | Strong mechanical skills; reduced procedural mistakes | Team members preparing for assessments or detailed reporting | Detailed worked examples; thorough algebraic walkthroughs |
| ZedStatistics (Justin Zeltzer) | Low–Medium, visual and analogy-driven explanations | Low, curated notes and videos; finite catalog | Complementary intuition-building and conceptual clarity | Complementing StatQuest/JB for cross-functional stakeholders | Visual topic hubs and memorable analogies |
| Richard McElreath (Statistical Rethinking) | High, university-level Bayesian, math-heavy | High, R/Stan code, strong statistical background needed | Advanced Bayesian modeling, hierarchical models, causal inference | Teams adopting Bayesian A/B testing or advanced modeling | Rigorous, gold-standard applied Bayesian training |
From Viewer to Practitioner. Turning Insights Into Action
Watching a strong statistics YouTube channel helps, but it won't improve your store on its own. The shift happens when you apply one concept immediately inside your existing workflow. Open your A/B testing dashboard, your GA4 exploration, or your Shopify Analytics report and force yourself to explain one output clearly. What does the interval mean, what assumption sits behind the test, and what would make the result untrustworthy?
That habit matters because YouTube is massive and easy to browse passively. Sprout Social reports 2.58 billion monthly active users, about 200 billion views per day, and more than 20 million videos uploaded daily, with Shorts reaching 2 billion monthly logged-in users in 2023. There's no shortage of content. The challenge isn't access. It's converting what you watch into decisions that improve merchandising, pricing, retention, and on-site conversion.
For eCommerce teams, the simplest operating model is this:
- Pick one concept at a time: Confidence intervals, power, sampling bias, or regression interpretation.
- Tie it to one current problem: A landing page test, offer test, product sort order, or post-purchase upsell.
- Document the decision: Write what the data says, what it doesn't say, and what action you're taking.
That process builds real capability fast. It also protects you from one of the biggest traps in growth work: overconfidence from partial understanding.
YouTube's audience concentration also makes it a useful channel for creators and learners alike. Statista reports YouTube registered over 2.5 billion global viewers in 2024, with India at almost 476 million users and the United States at 240 million users in January 2024, while YouTube Premium and YouTube Music reached 100 million paying users in 2024. For brands building internal training habits or even considering educational content as part of brand authority, that scale matters.
If you want a wider market view, audience reach is especially dense in major countries. Statista reports YouTube ad reach of 259 million in the United States, about 491 million users in India, and about 144 million in Brazil in early 2025 and 2026 measurement windows. That's useful context when your team localizes examples, benchmarks, or educational content for different markets.
For practical learning, don't binge seven channels at once. Start with one fundamentals channel and one intuition channel. Then apply the ideas to your own store. If you want extra reading alongside your video learning, this guide on best practices for Telegram channel growth is worth a look.
If your brand is ready to move from ad hoc testing to a serious, data-driven CRO program, working with a specialist can compress the learning curve. ECORN helps Shopify brands turn analytics, testing discipline, and experimentation strategy into sustained growth.
If you want a Shopify-focused team to turn statistical thinking into better tests, cleaner reporting, and stronger conversion gains, ECORN is a smart partner. Their team works across CRO, Shopify development, design, and growth strategy, which means they can help you not only understand the numbers but also ship the site changes that move them.


Scale Shopify Store
10 Shopify App Ideas Worth Building in 2026
Conversion Rate Optimization for Landing Pages: The Playbook
Shopify Plus Automation: A Guide for 2026
10 Social Selling Platforms for Shopify Merchants

Shopify Website Design Examples: 7 Stores Worth Studying
7 Ecommerce Newsletter Examples for Shopify Brands
One Product Shopify Store: Build and Scale

Mobile Pop Up Strategy for Shopify Stores That Converts
Sitemap for Shopify: How to Find, Optimize, and Submit It
7 Single Product Websites Worth Emulating
Product Variants Shopify: The Complete 2026 Guide
Ecommerce Analytics Consulting for Growth
What Is AI Integration for eCommerce
How to Choose the Right eCommerce Website Development Firm
E Business Strategy Implementation
Conversion Tracking Setup for Shopify Stores
BigCommerce vs Shopify Plus Which Enterprise Wins in 2026
Shopify Theme Kit: Setup, Commands, and Migration Guide
Shopify Extension Development: A Practical 2026 Guide
Shopify Speed Score Explained and How to Improve It
Shopify Mobile Optimization: The 2026 Playbook
How to Add Subcategory in Shopify for Better UX
How to Implement Structured Data for Ecommerce in 2026
SEO App Mobile: Shopify Store Optimization Guide
Shopify Plus Support: What It Includes and How to Choose
Google Ads for Shopify: The Complete 2026 Playbook
Shopify New York: How to Find and Hire the Right Agency
Google Search Console for Shopify: The Complete Setup
First Party Data Collection for eCommerce Growth
FAQ Online Store Guide: Build and Measure It Right
Do FB Ads Work for eCommerce in 2026?
One Page Checkout for Shopify: Design and Implementation
Shopify GraphQL vs REST: The 2026 Developer Decision
Shopify Ecommerce Consulting: Strategy, Pricing &

Are Reddit Ads Worth It for eCommerce Brands
Shopify Title and Meta Description: A Practical 2026 Guide
Product Video Best Practices for Shopify Brands
Real-Time Inventory Management: A 2026 Guide
AI Chatbot Integration for Shopify Stores
Affiliate Program Management: A Shopify Guide
10 Best Performance Monitoring Tools for Shopify in 2026
Digital Asset Management for eCommerce Brands in 2026
Every Type of Facebook Ads Explained for eCommerce Growth
Product Information Management Explained for Shopify Brands
Support Ticket System: A Guide for Shopify Stores

10 Best Customer Service Tools for Shopify in 2026

Can I Start a Business with No Money? a 2026 Blueprint

What Sells Good on Etsy: Best Niches for 2026

Shopify Add to Cart Button: A Practical 2026 Guide

Customer Feedback Automation: A Practical eCommerce Guide
Critical Rendering Path: A Guide for Shopify Stores

How to Promote on TikTok for eCommerce in 2026

B2B eCommerce Consulting That Drives Real Revenue
10 Best Practices for Site Navigation in 2026
Return vs Refund for Shopify Stores: A Practical Guide
What Is Customer Lifetime Value and Why It Matters
What Is Voice of Customer Research for eCommerce

SMS Marketing for Ecommerce That Actually Converts

Master How to Improve Email Deliverability in 2026

Top 7 eCommerce Partners NYC for Shopify Brands in 2026
Machine Learning for Ecommerce: Boost Your Shopify Store

Beauty Market Research: Your 2026 Growth Guide
Shopify International Expansion: A 2026 Roadmap
What Does CRO Stand for in Business: Understanding CRO

Shopify Visual Merchandising: A Playbook for Higher Sales

Shopify Landing Page Design: Master Conversion in 2026
10 Best AI SEO Optimization Tools for Shopify in 2026

Agentic AI for Ecommerce: Boost Your Sales in 2026
Mastering Email Marketing Data for eCommerce Growth

Conversion Rate Optimisation Australia: Boost Your Sales
Conversion Rate Optimization AI: Your Shopify Store Guide

10 Product Bundling Strategies for Shopify in 2026
How to Increase Customer Lifetime Value: A Shopify Playbook
AI Customer Service Automation: Shopify Guide 2026
Clean Website Design: A Shopify Conversion Playbook

Omnichannel Retail Strategy: A Shopify Playbook
Product Data Enrichment: A Guide for Shopify Brands

Instagram Shopping Features a Guide for Shopify Stores
What Is Revenue Optimization: A Holistic RevOps Guide
Benefits of Conversion Rate Optimization: Boost Your
WordPress to Shopify Migration: Your 2026 Seamless Switch
Boost Sales: Ecommerce Payment Processing Guide 2026
Unified Commerce Platform: Benefits, KPIs & Shopify Guide

How to Reduce Bounce Rate eCommerce: Your 2026 Guide
Shopify API Integration: A Practical End-to-End Guide
How to Implement Data Governance: A 2026 Guide
Shopify Store Development Cost: A 2026 Breakdown
What Is Server Side Tracking: The Shopify Guide 2026
Marketing Automation Workflows: A Shopify Guide for 2026
Shopify: How to Reduce Technical Debt

Shopify UX Design Change: A Playbook for Growth
User Generated Content Strategy: Shopify Playbook
Shopify Pause and Build Plan Cost: A Complete 2026 Guide
Compare at Price on Shopify: A Complete Guide for 2026

Where Can I Sell My Prints? 10 Best Platforms for 2026
Shopify Order Management System: The Ultimate Guide 2026
What Is Marketing Attribution? an eCommerce Guide for 2026

10 Best Black Friday Sales Sheets for 2026

Discover the Top Social Media Marketing Agencies For


newsletter in your inbox