


You launched on Monday. By Thursday the variant is up 14% and the dashboard is green. You ship it, and three weeks later revenue hasn't moved at all. Nothing was wrong with the change. The number that told you it won came from roughly 900 visitors per arm, and 900 visitors can't tell a real lift from a lucky Tuesday.
A/B test sample size is the part of experimentation people skip, because it feels like the calculator's job. It isn't. The number you need depends on your baseline rate, the smallest lift you'd act on, your traffic, and what a wrong call costs you. Work it out first and every later decision gets easier. Skip it and a confidence interval becomes a very confident way of being wrong.
Visitors Needed for Common Baselines and Lifts
Here's the answer many readers came for. The table gives visitors per variant at 95% significance and 80% power, for a two-sided test with one control, one variant, and an even 50/50 split.
| Baseline conversion rate | Relative lift | Visitors per variant | Total visitors (two arms) |
|---|---|---|---|
| 2% | 10% (2.0% to 2.2%) | about 77,000 | about 154,000 |
| 2% | 20% (2.0% to 2.4%) | about 19,500 | about 39,000 |
| 5% | 10% (5.0% to 5.5%) | about 30,000 | about 60,000 |
| 5% | 20% (5.0% to 6.0%) | about 7,500 | about 15,000 |
| 10% | 10% (10% to 11%) | about 14,000 | about 28,000 |
| 10% | 20% (10% to 12%) | about 3,500 | about 7,000 |
Every cell comes from one approximation: n ≈ 16 × p(1−p) ÷ d², where p is the baseline rate written as a decimal and d is the absolute change you want to detect. On a 2% baseline, a 10% relative lift means moving from 2.0% to 2.2%, so d is 0.002.
Read the pattern before you read your own row
- Halving the lift costs about four times the traffic. At a 2% baseline, 10% needs about 77,000 per variant and 5% needs roughly 300,000. Sensitivity is the most expensive thing you can ask for.
- A low baseline is expensive. The same 10% relative lift costs about 77,000 visitors per variant at a 2% baseline and about 14,000 at a 10% baseline. Small rates produce noisy averages, and noise has to be drowned out with volume.
- Per-variant is not total. The most common planning error is reading the middle column as the whole test. A 5% baseline chasing a 10% lift needs about 60,000 visitors across both arms, not 30,000.
Practical rule: write down the total for your row, then compare it with the number of eligible visitors you get in a month. If the total is bigger, you don't have a sample size problem. You have a design problem.
Your baseline is the one number you can't borrow from this table. Measure it on the exact funnel step you're testing, over a full month of normal traffic, with the same eligibility rules in both arms. Category benchmarks are useful as a sanity check: ECORN's ecommerce conversion rate benchmarks show how wide the spread is between store types, so a 2% row is entirely normal in some categories and far too low in others.
Find your row, note the total, and answer one question: Can you fill that number in the next six weeks? If yes, you have a test. If not, you have a business decision to make.
The Four Inputs That Set Your Sample Size
Every calculator asks for the same handful of numbers. Knowing what each one does to the result is what turns a tool into a plan.
| Input | What it means | Effect of demanding more | Usual setting |
|---|---|---|---|
| Baseline conversion rate | Current rate of the control | A higher baseline needs fewer visitors | Measured over the last 2-4 weeks |
| Minimum detectable effect | Smallest lift worth acting on | A larger lift needs fewer visitors | 10-20% relative |
| Significance level | Accepted risk of a false winner | A stricter risk, such as 1% instead of 5%, needs more visitors | 5% (95% confidence) |
| Statistical power | Chance of catching a real lift | 90% power needs about a third more visitors than 80% | 80% |
| Number of variants | Each extra arm splits the traffic | More arms need more total visitors | 2 for a simple test |
The baseline deserves the most care because everything downstream inherits its noise. Pull it from two to four weeks of ordinary trading on the step you're testing, not from a sitewide average that blends homepage browsers with checkout completers. A baseline measured over a flash sale week will plan you a test that never finishes.
Why the minimum detectable effect is a business decision
Nothing in the statistics knows what a 6% lift is worth to your store. The formula will happily plan a test for any lift you name. The judgment is yours: which improvement would pay for the build, the wait, and the traffic you're holding back from other work?
Most established stores land between 10% and 20% relative, which is large enough to be worth shipping and small enough to be reachable.
Significance and power are the two risks you're accepting rather than decisions about your business. A 5% significance level means one false winner in twenty tests when nothing is really happening. Power is the mirror image: at 80%, you have a one in five chance of missing a lift that exists.
The number of variants is structural. A third arm splits the same traffic three ways, and comparing several treatments against one control also invites more false positives, so the total rises twice over. Stay at two arms until the first question is answered.
Sanity check before you build: if the lift you chose wouldn't cover the cost of shipping the change, the test is too sensitive. Raise the lift, shorten the run, and accept that you'll only catch bigger swings.
The last step is the one people skip. Take the lift you selected, convert it to money at your current revenue, and ask whether that sum justifies the weeks the test will take. If it doesn't, the sample size is technically correct and practically pointless.
How to Calculate Your Sample Size Step by Step
Say you're testing a checkout layout, and 5% of sessions reaching checkout complete a purchase. Walk those numbers through six steps and you'll be able to check any calculator against your own arithmetic.
The flow below maps the same sequence, from pulling the baseline to reading the required sessions per variant.
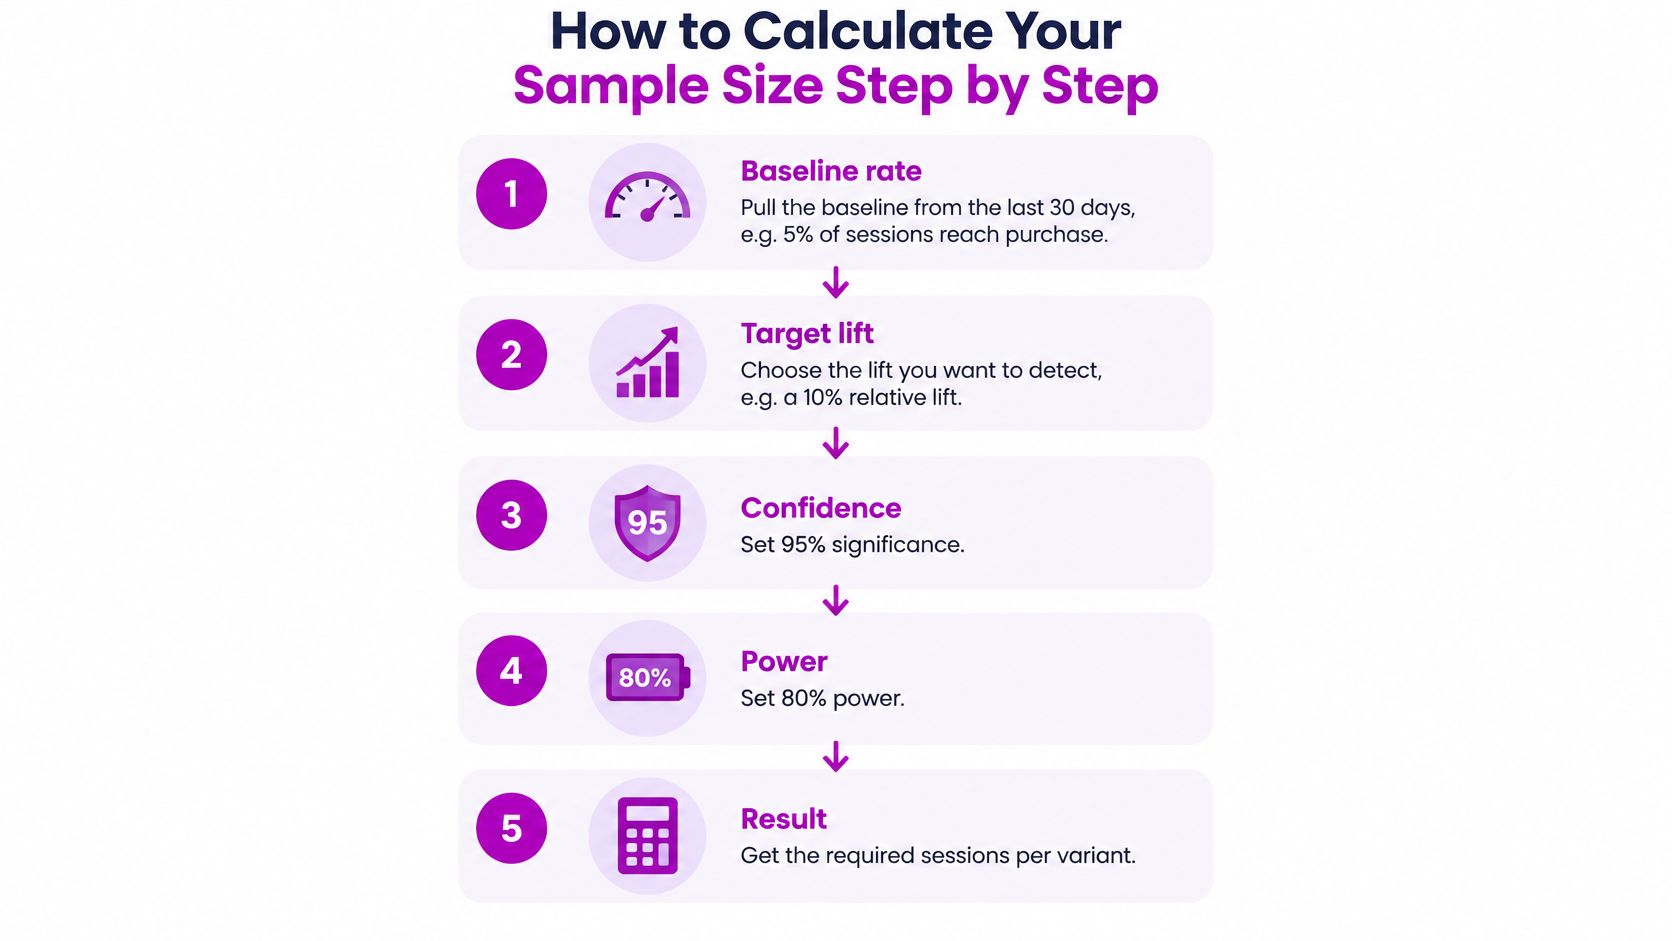
- Pull the baseline from the last 30 days. Use the funnel step you're testing, so 5% of checkout sessions completing a purchase, and count each visitor once. Sessions counted twice will inflate your plan and shrink your real sample.
- Choose the smallest relative lift worth acting on. A 10% target here takes 5.0% to 5.5%, an absolute change of half a percentage point. Confirm whether your tool wants the relative or the absolute figure before you type it.
- Fix significance and power. Two-sided 5% significance and 80% power. Write both into the test document so nobody renegotiates them mid-run.
- Run the formula. 16 × 0.05 × 0.95 ÷ 0.005² ≈ 30,000 visitors per variant. The numerator is small because the baseline is far from 50%, which is why high-converting steps need less traffic than you'd expect.
- Double it for two arms. 60,000 total. If you read the per-variant figure as the total, each arm gets 15,000 and the test carries roughly half the power you planned for.
- Divide by eligible daily visitors. At 2,000 a day, 60,000 takes about 30 days. At 500 a day it takes about 120 days, which is the moment to change the question rather than the arithmetic.
Two settings cause most wrong answers. One is a calculator expecting an absolute lift when you've entered a relative one, which plans a test hundreds of times too small. The other is an output labelled per variant that gets copied into a plan as the total. Check both labels before you trust the number.
The arithmetic above also lets you audit a tool. Enter your baseline and lift into any calculator, compare its output with the 30,000 you just derived, and if the two disagree by more than rounding, one of you has a wrong input.
How Long Your Test Must Run
A sample size tells you how many visitors you need. Traffic tells you how long you will be waiting for them, and two stores running the identical test can face waits that differ by months.
Take the 2% baseline and 10% relative lift example, which needs about 154,000 visitors across both arms. A high-traffic store pulling 20,000 eligible visitors a day recruits them in about eight days. A smaller store at 2,000 a day waits about 77 days for the same answer.
Eligible visitors means only the people who reach the page or step under test. A store with 10,000 daily sessions recruits far fewer if the test lives on the checkout page, so measure traffic where the test lives, not at the front door.
| Daily eligible visitors | Days to reach 154,000 visitors | Practical test length |
|---|---|---|
| 2,000 | 77 | 11 weeks |
| 5,000 | 31 | 4-5 weeks |
| 10,000 | 16 | 2-3 weeks |
| 20,000 | 8 | 2 weeks |
The same experiment is a two-week project for one store and a quarter-long commitment for another. Before launch, weigh the question against tying up that page for the duration.
Why full weekly cycles matter
The arithmetic can finish mid-week. The calendar should not. Weekday and weekend buying behaviour differ, so a test that runs Monday to Monday captures a full cycle while one that ends Wednesday captures a mood.
The Nielsen Norman Group's guide to A/B testing recommends running a test for at least one to two weeks to account for fluctuations in user behavior. Treat that as a floor. If your sample size arrives in eight days, run the two full weeks anyway. If it needs eleven weeks, the one-to-two-week minimum was never in the running.
Round every duration up to complete weeks, then add a small buffer for the traffic dip you will probably hit when a campaign ends or a sale runs out. A four-week plan that meets a quiet fortnight becomes a six-week test, and six weeks is a long time to watch a flat line without calling it early.
Set the end date before launch, from the visitor count, not from the moment the dashboard turns green.
That single habit removes the stop decision from the person watching the graph, which is where most early calls come from.
Why Small Stores Often Cannot Reach Significance
Here's the uncomfortable part. A store converting at around 1.4% and shopping for a 10% relative lift needs a six-figure audience in each arm. Most emerging Shopify brands have a fraction of that.

One ecommerce conversion rate optimization guide sets out the arithmetic plainly: at a 1.4% baseline, detecting a 10% relative improvement takes about 112,686 sessions per variant, and detecting a 5% lift takes about 450,743 sessions per variant (blkdg.com's CRO guide). The same guide notes the consequence most dashboards hide, which is that for many smaller stores conventional A/B testing is statistically underpowered even when the dashboard reports a positive result.
A positive reading on 3,000 visitors per arm isn't evidence. It's the variance of a small sample wearing a green badge.
Three ways out, in order of how often they work
- Test a higher-volume event. Add-to-cart or checkout initiation happens to far more visitors than a completed purchase, so the baseline is higher and the sample arrives sooner. You learn about the top of the funnel at a speed the bottom never allows.
- Accept a bigger lift. A 20% target needs a fraction of the traffic of a 10% target. You'll only catch bold changes, and at low volume bold changes are usually the only ones worth shipping anyway.
- Call the test directional. Run it to decide the next test, not to crown a winner. Report the estimate with its uncertainty and move.
Then there's the economic question, which matters more than any of these. Compare the traffic and time a test consumes with what detecting that lift is worth. A 2% lift on a store earning 20,000 a month is worth about 400 a month. If proving that lift takes nine weeks of split traffic, the maths has already answered, and the answer isn't the experiment you were planning.
Mistakes That Break Sample Size Planning
A correctly sized test still fails if the test around it moves. These six mistakes account for most of the wreckage.
- Peeking every morning. Checking daily and stopping at the first significant reading inflates false winners well beyond the 5% you signed up for. Lock the end date in the test document before launch.
- Stopping early because the result looks strong. Same mechanism, different intention. The visitor count decides when the test ends, not the size of the number on the screen.
- Changing traffic mid-test. A campaign that sends a different audience into one arm turns the comparison into two different experiments. Keep the traffic mix constant for the full run.
- Slicing after the fact. Test twenty segments post hoc and one will look like a winner by chance. Define your segments before launch and treat the rest as leads for a new test.
- Adding a variant mid-test. A third arm splits the same traffic and raises the total you need. Recalculate before adding, never after.
- Planning on conversion and judging on revenue. Revenue per visitor swings far more than a binary conversion rate because one large order moves the average. Plan the sample for the metric you'll decide on.
Most of these are process failures rather than statistical ones, which is why ECORN's A/B testing best practices puts stopping rules and traffic control ahead of test ideas. A modest test with a locked rule beats an ambitious test with a movable one every time.
Decide Whether the Test Is Worth the Traffic
A store with 10,000 eligible visitors a day finishes a 60,000-visitor test in six days. A store with 1,000 a day needs about nine weeks. The calculator returns the same number for both, and the decision is not the same: for one store the test is a routine launch call, for the other it ties up a full quarter of traffic chasing a result that may not move monthly revenue.
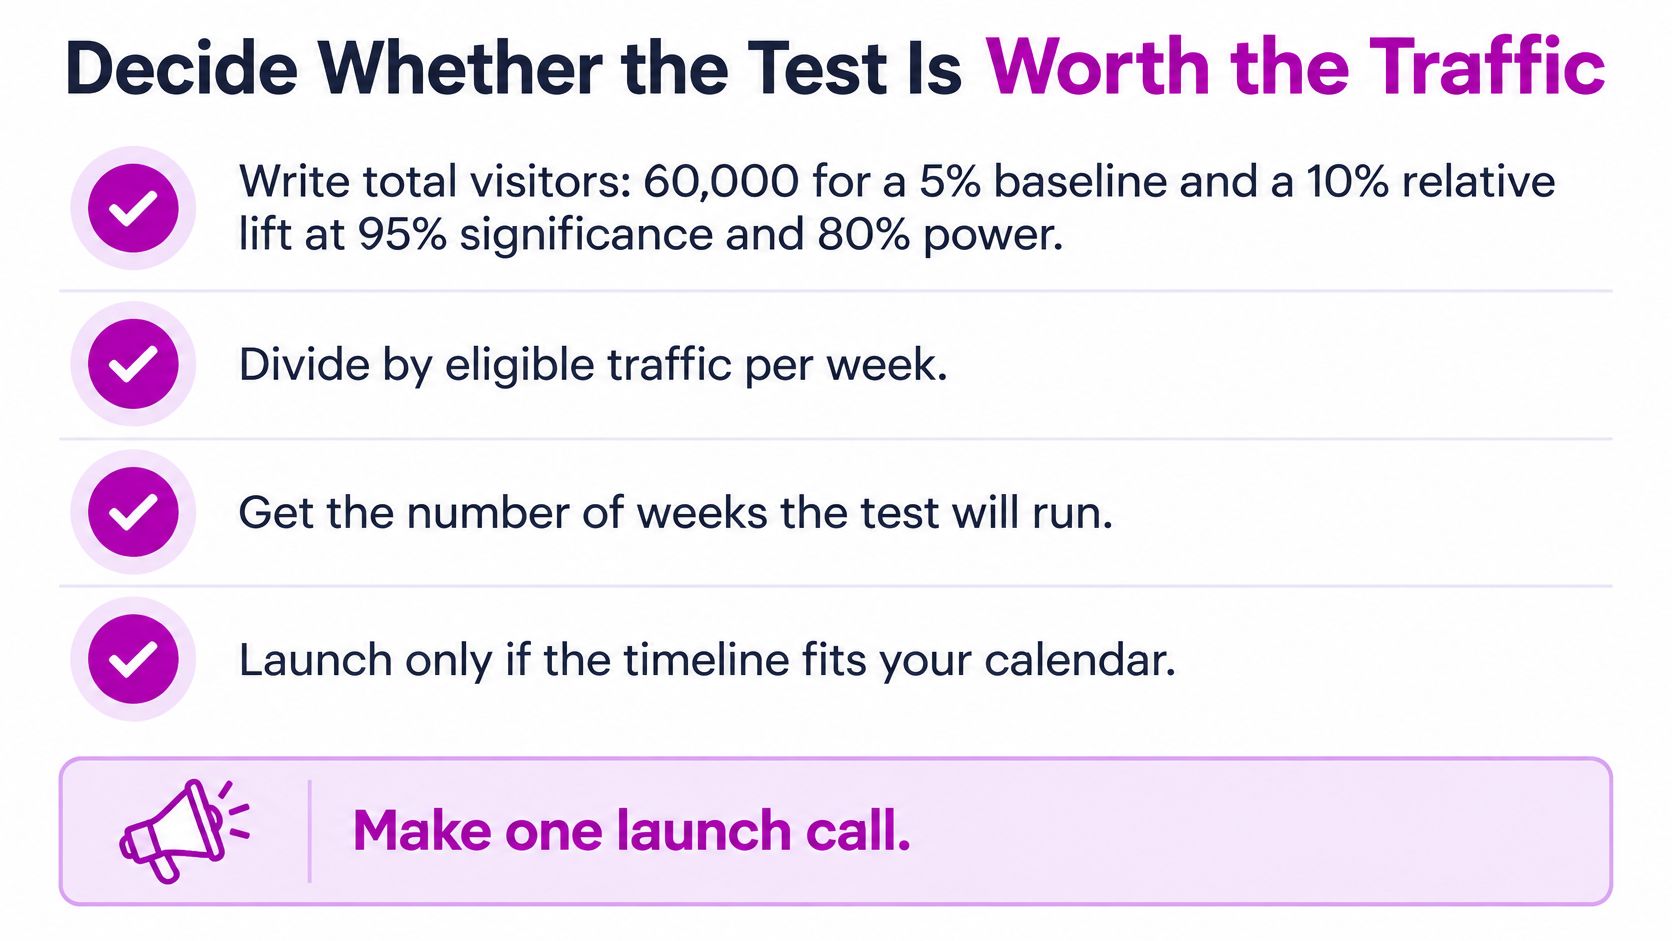
- Write the total down. A 5% baseline with a 10% relative lift, at 95% significance and 80% power, needs 60,000 visitors across both arms.
- Divide by eligible daily visitors. At 1,000 a day that's 60 days, about nine weeks. At 10,000 a day it's six days, and the test still runs two full weeks so the calendar covers whole cycles.
- Price the lift. On 20,000 in monthly revenue, a 10% change is about 2,000 a month. A target small enough to demand nine weeks of traffic is worth a fraction of that.
- Compare the wait with the gain. If the weeks of split traffic cost more than a few months of that gain, don't launch. Use the higher-volume event, the larger lift target or the directional read instead.
- Launch only if the row fits two to four full weeks. Lock the end date, hold the traffic mix steady, and judge the result on the metric you planned for.
Step 3 is the revenue half of the decision and step 4 is the traffic half. A test earns its launch only when both halves clear at once, which is why a result that looks clean on paper can still be a bad trade for a small store and a good one for a large store.
If you'd rather hear the reasoning than read it, this walkthrough covers the same ground in conversation.
An hour of review before you commit is usually the difference between a test that answers a question and a test you abandon.
ECORN's Shopify conversion rate optimization work includes a CRO audit with recommendations and bug fixing, A/B testing, and scaling hypotheses. If you'd like a second pair of eyes on whether your next test can ever reach significance, ECORN will walk the numbers with you before you spend a month of traffic on them.



Shopify Social Proof: 7 Apps That Build Buyer Trust

10 Best Shopify Design App Tools for 2026: Pros and Cons
Shopify Local Development: Setup, Workflow and Fixes

Shopify Theme Minimal: How to Design and Build One
Consistent Website Design: A Practical Guide for Stores

Shopify Development Company in USA Hiring Guide
Shopify Inventory Tracking App: How to Set It Up Right

Shopify Volume Pricing: How to Set Up Tiered Discounts
How Does Shopify Work for Sellers? a Practical Guide
Shopify Theme ZIP: How to Upload and Install It
Shopify Plus Organization Admin: Roles and Access Guide
How to Build a Drop Down Menu in Shopify: Steps and Fixes
Shopify Plus Integration Services Guide

Shopify Customer Experience: A 2026 Guide

AI Lead Generation for E-commerce Growth

Shopify Plus Expansion Stores: Limits and Setup
Shopify Theme Update: Safe Steps, Backups and Rollback

Shopify Website Design Packages: What You Actually Get

How to Choose a Shopify Plus Web Design Agency in 2026
Shopify Plus Ecommerce Agency: How to Pick the Right One

Shopify Themes Retina: How to Serve 2x Images

How to Cross Sell on Shopify Without Friction

Best Shopify Theme for Custom Products Compared
Multi Store Inventory Management: A Practical Guide

SEO Consulting for Ecommerce: A Practical Guide

Shopify Theme Updater App: A Safe Update Playbook

Shopify Git Integration: A Developer's Guide to 2026
Headless Ecommerce Development Services Explained

How to Build a Shopify Clothing Website That Converts
How to Launch a Box Subscription Business in 2026

Luxury Skincare Branding Playbook That Converters

11 Best Podcast Ecommerce Shows for Store Growth in 2026
Shopify Developer Hourly Rate: What to Pay in 2026

Critical Shopify Setup Errors That Are Secretly Sabotaging Your Store
Ecommerce Conversion Tracking: The Complete How-To Guide
Shopify Design Agency: How to Pick the Right Partner
Mastering Multi Store Management on Shopify

Scale Shopify Store

10 Shopify App Ideas Worth Building in 2026
Conversion Rate Optimization for Landing Pages: The Playbook
Shopify Plus Automation: A Guide for 2026
10 Social Selling Platforms for Shopify Merchants

Shopify Website Design Examples: 7 Stores Worth Studying

7 Ecommerce Newsletter Examples for Shopify Brands
One Product Shopify Store: Build and Scale

Mobile Pop Up Strategy for Shopify Stores That Converts
Sitemap for Shopify: How to Find, Optimize, and Submit It
7 Single Product Websites Worth Emulating

Product Variants Shopify: The Complete 2026 Guide
Ecommerce Analytics Consulting for Growth

What Is AI Integration for eCommerce
How to Choose the Right eCommerce Website Development Firm
E Business Strategy Implementation
Conversion Tracking Setup for Shopify Stores
BigCommerce vs Shopify Plus Which Enterprise Wins in 2026
Shopify Theme Kit: Setup, Commands, and Migration Guide

Shopify Extension Development: A Practical 2026 Guide
Shopify Speed Score Explained and How to Improve It
Shopify Mobile Optimization: The 2026 Playbook
How to Add Subcategory in Shopify for Better UX
How to Implement Structured Data for Ecommerce in 2026

SEO App Mobile: Shopify Store Optimization Guide
Shopify Plus Support: What It Includes and How to Choose

Google Ads for Shopify: The Complete 2026 Playbook

Shopify New York: How to Find and Hire the Right Agency

Google Search Console for Shopify: The Complete Setup

First Party Data Collection for eCommerce Growth
FAQ Online Store Guide: Build and Measure It Right
Do FB Ads Work for eCommerce in 2026?

One Page Checkout for Shopify: Design and Implementation

Shopify GraphQL vs REST: The 2026 Developer Decision
Shopify Ecommerce Consulting: Strategy, Pricing &

Are Reddit Ads Worth It for eCommerce Brands

Shopify Title and Meta Description: A Practical 2026 Guide

Product Video Best Practices for Shopify Brands
Real-Time Inventory Management: A 2026 Guide

AI Chatbot Integration for Shopify Stores
Affiliate Program Management: A Shopify Guide
10 Best Performance Monitoring Tools for Shopify in 2026

Digital Asset Management for eCommerce Brands in 2026
Every Type of Facebook Ads Explained for eCommerce Growth
Product Information Management Explained for Shopify Brands
Support Ticket System: A Guide for Shopify Stores

10 Best Customer Service Tools for Shopify in 2026

Can I Start a Business with No Money? a 2026 Blueprint

What Sells Good on Etsy: Best Niches for 2026

Shopify Add to Cart Button: A Practical 2026 Guide

Customer Feedback Automation: A Practical eCommerce Guide
Critical Rendering Path: A Guide for Shopify Stores

How to Promote on TikTok for eCommerce in 2026

B2B eCommerce Consulting That Drives Real Revenue
10 Best Practices for Site Navigation in 2026
Return vs Refund for Shopify Stores: A Practical Guide
What Is Customer Lifetime Value and Why It Matters

What Is Voice of Customer Research for eCommerce

SMS Marketing for Ecommerce That Actually Converts

Master How to Improve Email Deliverability in 2026

Top 8 eCommerce Partners NYC for Shopify Brands in 2026

Machine Learning for Ecommerce: Boost Your Shopify Store

Beauty Market Research: Your 2026 Growth Guide


newsletter in your inbox