

You've opened Shopify admin to check your store's speed and found a number that doesn't match what you expected. The homepage looks acceptable on your laptop, yet a product page feels sluggish on a phone. Or the score changes after a theme edit, even though you didn't intentionally change anything related to performance.
That confusion is reasonable. Shopify speed score isn't a complete report card for every page, shopper, device, or country. It's a useful signal, but it combines selected templates and performance metrics in a way that can hide important differences. A store can have a respectable admin score while a campaign landing page struggles, or a lower score while its real shoppers still receive an acceptable experience.
Speed matters because shoppers need to see the main content quickly, interact with product controls smoothly, and avoid unexpected movement on the page. It also matters for conversion work, but a faster-looking laboratory result isn't automatically a better business outcome.
This guide explains what Shopify measures, why the score fluctuates, how Core Web Vitals change the interpretation, and which fixes deserve attention first. The practical objective isn't a perfect 100. It's finding the templates and devices creating the most friction, improving them without damaging merchandising or conversion paths, and knowing when further score chasing has stopped being useful.
Introduction Why Your Shopify Speed Score Feels Confusing
A merchant named Maya checks her Shopify admin before launching a seasonal campaign. The speed score is lower than it was during the previous review, so she starts looking for a single explanation. Did a new product image cause it? Is the theme too heavy? Should she remove the review widget, the quiz, or the sticky cart?
She runs a Lighthouse test on her desktop and sees a different result. On the homepage, the hero image appears quickly. On her phone, however, the product gallery takes longer to settle, and the variant selector hesitates when tapped. Maya now has three signals, all apparently describing “speed,” but none gives her a simple yes-or-no answer about sales.
That's the central problem with treating the Shopify speed score as a business KPI. The score is valuable for spotting performance movement, but it's a simplified view of selected pages. It doesn't tell you that every product template, landing page, cart interaction, and device behaves identically.
Practical rule: Use the admin score to ask better questions, not to end the investigation.
A store's performance has two sides. The first is what a controlled test observes, such as rendering and script work under a defined setup. The second is what real shoppers experience across devices, connections, page types, and locations. Those sides often overlap, but they aren't interchangeable.
The rest of the analysis becomes easier once you separate three decisions:
- Interpret the signal: Understand what pages and metrics influence the number.
- Find the drag: Identify whether images, layout changes, or JavaScript create the problem.
- Validate the result: Check real-user data by page type and device, then compare the change with conversion behavior.
A score in the 90s can still leave an important product page with an interaction problem. A score below the old target range can also point to a limited template issue rather than a store-wide failure. The right response depends on what shoppers are experiencing.
What Shopify Speed Score Actually Measures
Maya opens the Shopify admin and sees a single number beside several very different page experiences. That number comes from a controlled performance test, so it can move after a theme, app, or template change without representing every page in the store.
Shopify's earlier online store speed reporting used Google Lighthouse. Lighthouse combines several performance metrics into one Performance score, which means the result can vary as the tested page or its resources change. The historical scoring method is explained in this overview of Shopify Lighthouse performance scoring.
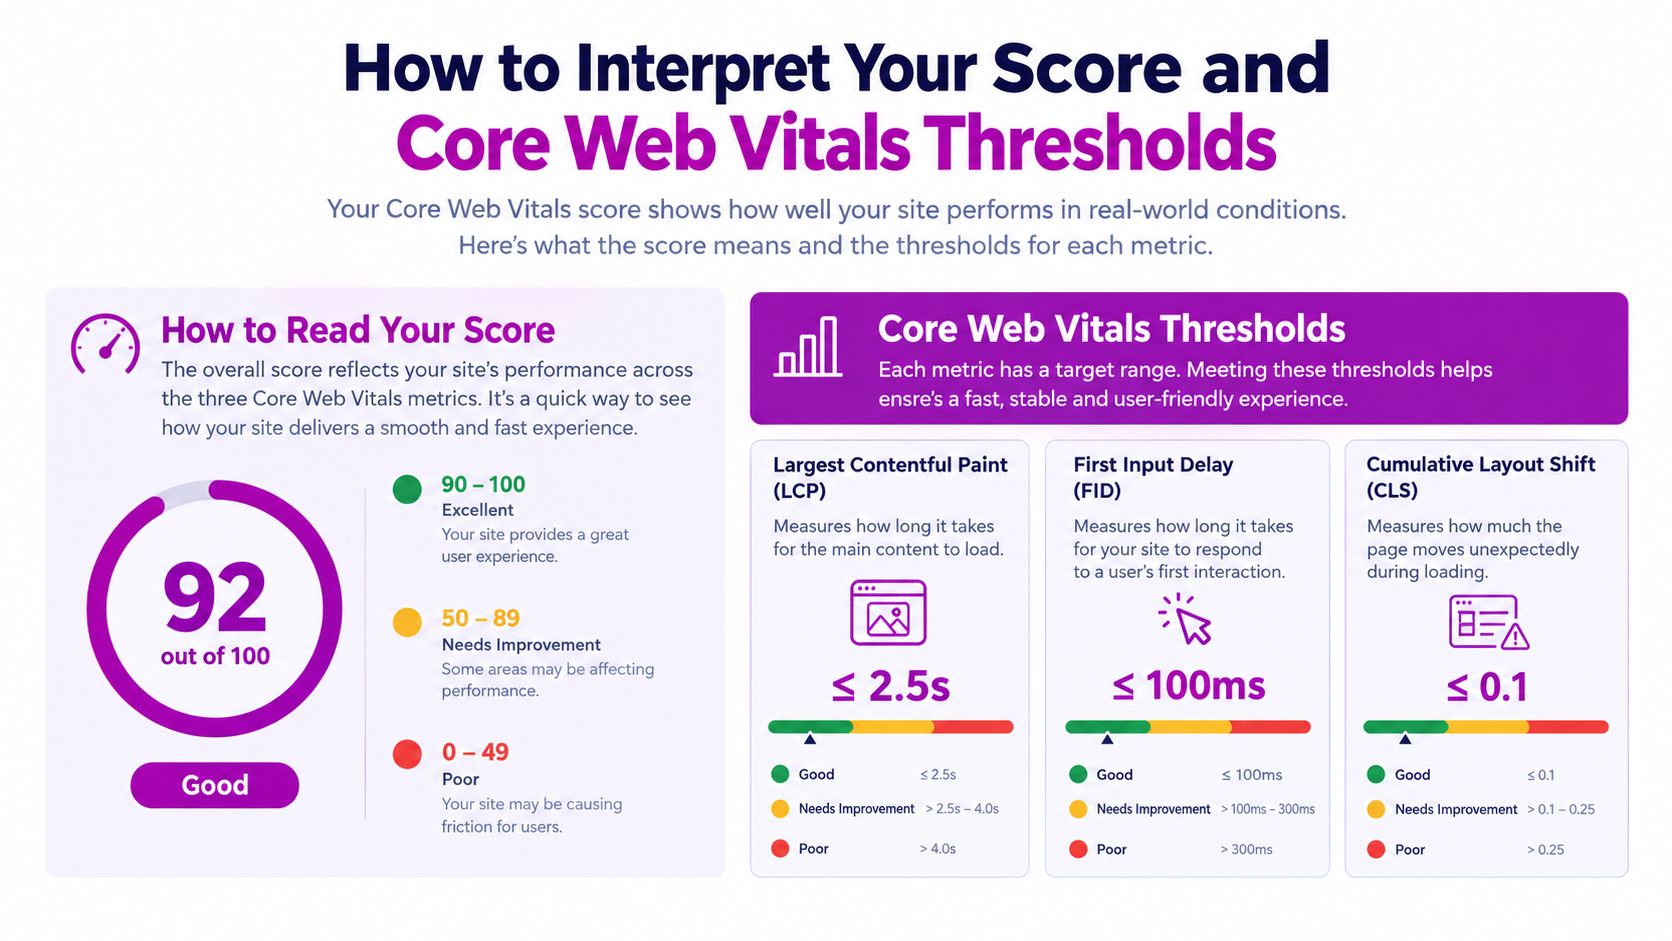
The old scale classified 0 to 49 as poor and 50 to 89 as needing improvement. Those bands explain why earlier advice often focused on reaching the 70 to 80 range. The score was a lab signal for page performance, not a direct reading of revenue or conversion rate.
A vehicle inspection provides a useful comparison. One car travels on a controlled track while specific conditions are checked. Real-user data shows the same vehicle on different roads, with different loads, weather, and drivers. Both views are useful, but they answer different questions.
The three templates behind the admin view
Shopify's admin speed score is a weighted average of Lighthouse Performance scores from three pages: the homepage, the highest-traffic product page, and the highest-traffic collection page. Shopify's guidance on a good speed score describes this calculation. The result is a three-page template signal, not a whole-store KPI.
That distinction changes how you investigate a result. A high-traffic product template with a large image gallery and several app blocks can influence the score more than a low-traffic campaign landing page. A serious issue on an untested template may barely move the admin number, even if shoppers notice it immediately.
Lighthouse's Performance score combines First Contentful Paint, Largest Contentful Paint, Speed Index, Total Blocking Time, and Cumulative Layout Shift. Hero content, layout stability, and main-thread JavaScript therefore affect the composite score together. Improving one isolated detail may matter less than removing work that delays the page's main content or blocks interaction.
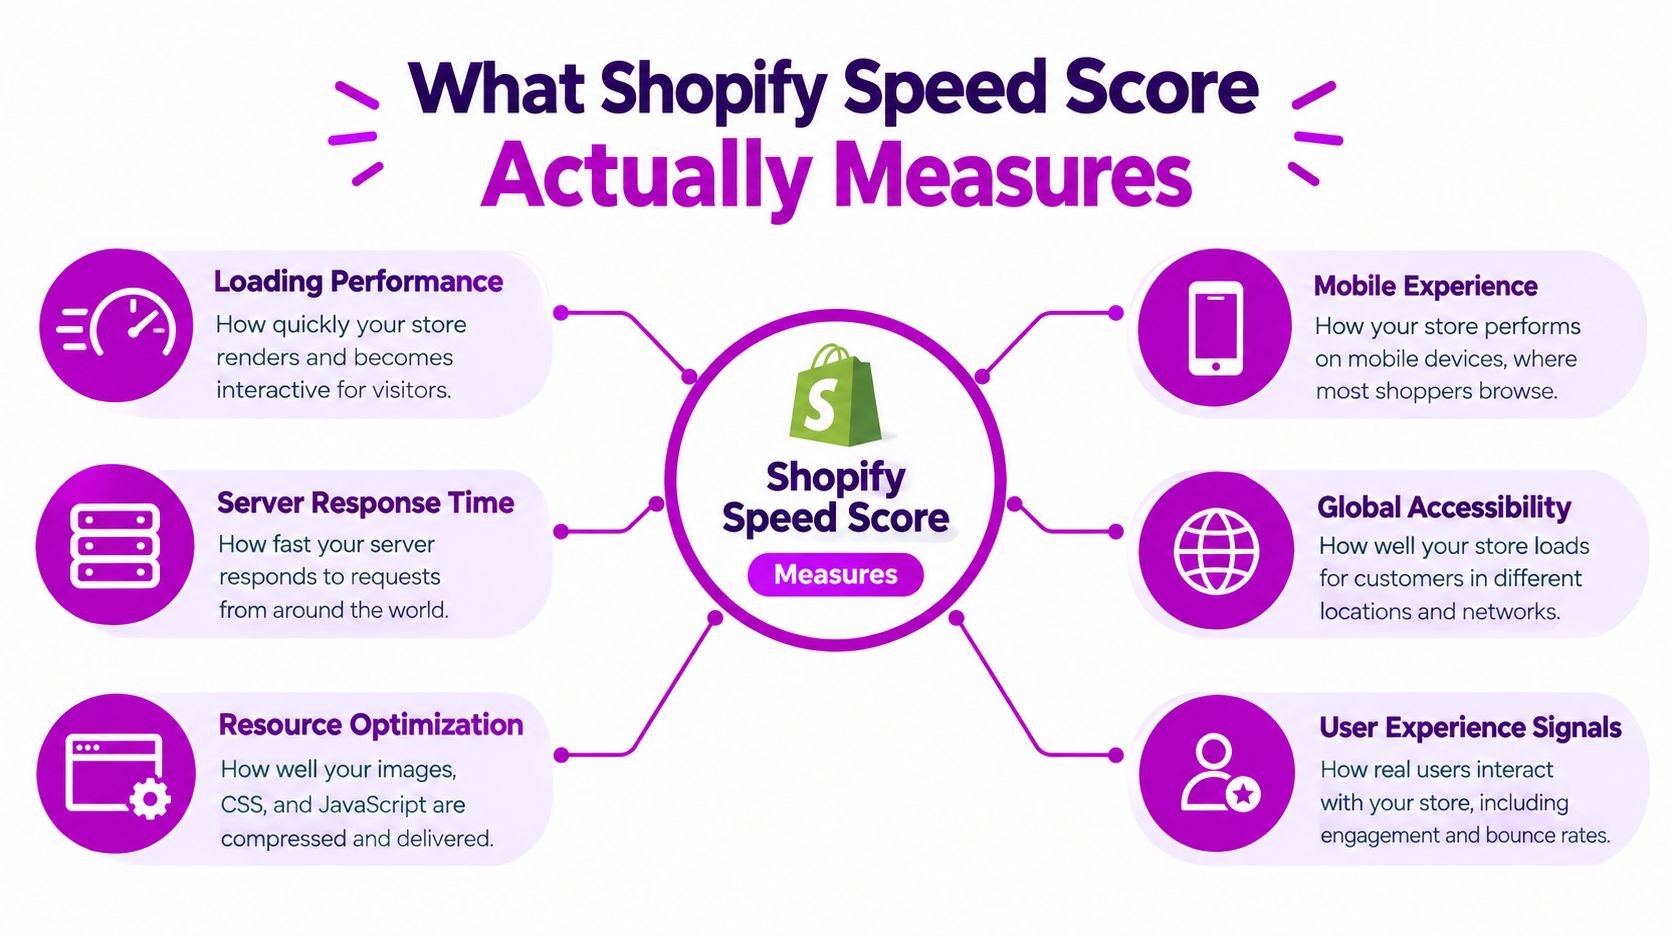
Shopify's newer performance reporting focuses on Core Web Vitals measured from real user data. It includes available data from the last 90 days and review windows for Today, Last 7 days, and Last 30 days, as described in Shopify's web performance reports documentation. Use that view to examine page types and devices. Once the score stops revealing a clear template problem, real-user Core Web Vitals become the better guide for deciding what to fix.
How to Interpret Your Score and Core Web Vitals Thresholds
The Lighthouse ranges described earlier provide context for the admin score. They should not become the store's main target. Shopify's current performance view focuses on three Core Web Vitals, which describe how real shoppers experience a page:
- Largest Contentful Paint, or LCP: The main visible content should render in under 2.5 seconds.
- Interaction to Next Paint, or INP: The page should respond to interaction in under 200 milliseconds.
- Cumulative Layout Shift, or CLS: The stability score should be 0.1 or lower.
A store earns a good experience only when at least 75% of page loads fall within the good range for these metrics. That rule matters because it evaluates repeated visits across shoppers, devices, and connections, rather than one successful test in controlled conditions. The infographic below summarizes the thresholds:
Treat the score as a three-page template signal
A Shopify speed score is best read as a signal from three representative templates, not as a whole-store KPI. A change after a theme or product-template update may show that one sampled page changed, but it does not prove that every URL became faster or slower. Lighthouse results can also vary with page content and test conditions.
Start by identifying which template moved: the homepage, main product page, or main collection page. Then match the weak metric to the likely experience. Low LCP means the page's primary content arrives late. Low INP points to delayed response after a tap or click. High CLS indicates that visible content shifts while the page loads.
Next, compare the result with real-user data by page type and device. If mobile product pages show the same weakness, they deserve attention even when the admin score barely changes. A campaign landing page can also outrank a sampled template when it supports an important buying action.
The practical trade-off is simple: improve the score when it reflects a real template problem. Stop chasing it when the number rises without better user experience. At that point, prioritize the Core Web Vital that affects shoppers on the page and device where the problem occurs.
Common Performance Bottlenecks on Shopify Stores
Most Shopify performance problems come from familiar parts of the storefront, but the visible symptom doesn't always identify the cause. A page can show its hero image quickly and still feel unresponsive when a shopper opens a variant selector. Another page can appear stable at first, then shift when a review block or promotional banner arrives.
Shopify's theme performance best practices connect common Core Web Vital problems with specific implementation choices. LCP often suffers when the largest viewport element, such as a hero image or main product media, loads slowly. CLS commonly comes from images without dimensions, late-loading fonts, or content injected by apps. INP is heavily influenced by JavaScript work on the main thread.
LCP and the first meaningful visual
On a homepage, the LCP element is often the hero image, headline, or promotional banner. On a product page, it may be the primary product image. If the theme lazy loads that element, requests an oversized asset, hides it behind a slider script, or discovers it late through JavaScript, the shopper waits for the page's most important visual.
Above-the-fold content deserves special attention because it controls the first impression. A large video background, rotating carousel, or complex animated section may be visually attractive, but it also asks the browser to download, parse, and render more work before the page feels ready.
CLS and unexpected movement
Layout shifts usually begin with missing space reservations. An image without intrinsic dimensions gives the browser no reliable area to hold before the asset arrives. A font swap can change text width, while an app-injected review block, announcement bar, or recommendation widget can push existing content downward.
The fix isn't always to remove the feature. A theme can reserve space, define stable aspect ratios, and render important blocks earlier. The aim is to let shoppers understand where content will appear before late assets change the layout.
INP and interaction delay
INP exposes a different kind of problem. A screenshot may look complete while the browser remains busy processing app scripts, tracking code, popups, chat tools, product widgets, or large theme bundles. When a shopper taps a variant or opens the cart, that queued work can delay the visual response.
This is why mobile testing matters. Mobile devices typically have less processing capacity than desktop systems, so JavaScript that seems harmless in a desktop lab test can make product interactions feel heavy on a phone.
For a deeper explanation of the browser's loading sequence, see this guide to the critical rendering path. It helps explain why early CSS and JavaScript can delay visible content even when the files themselves don't look large.
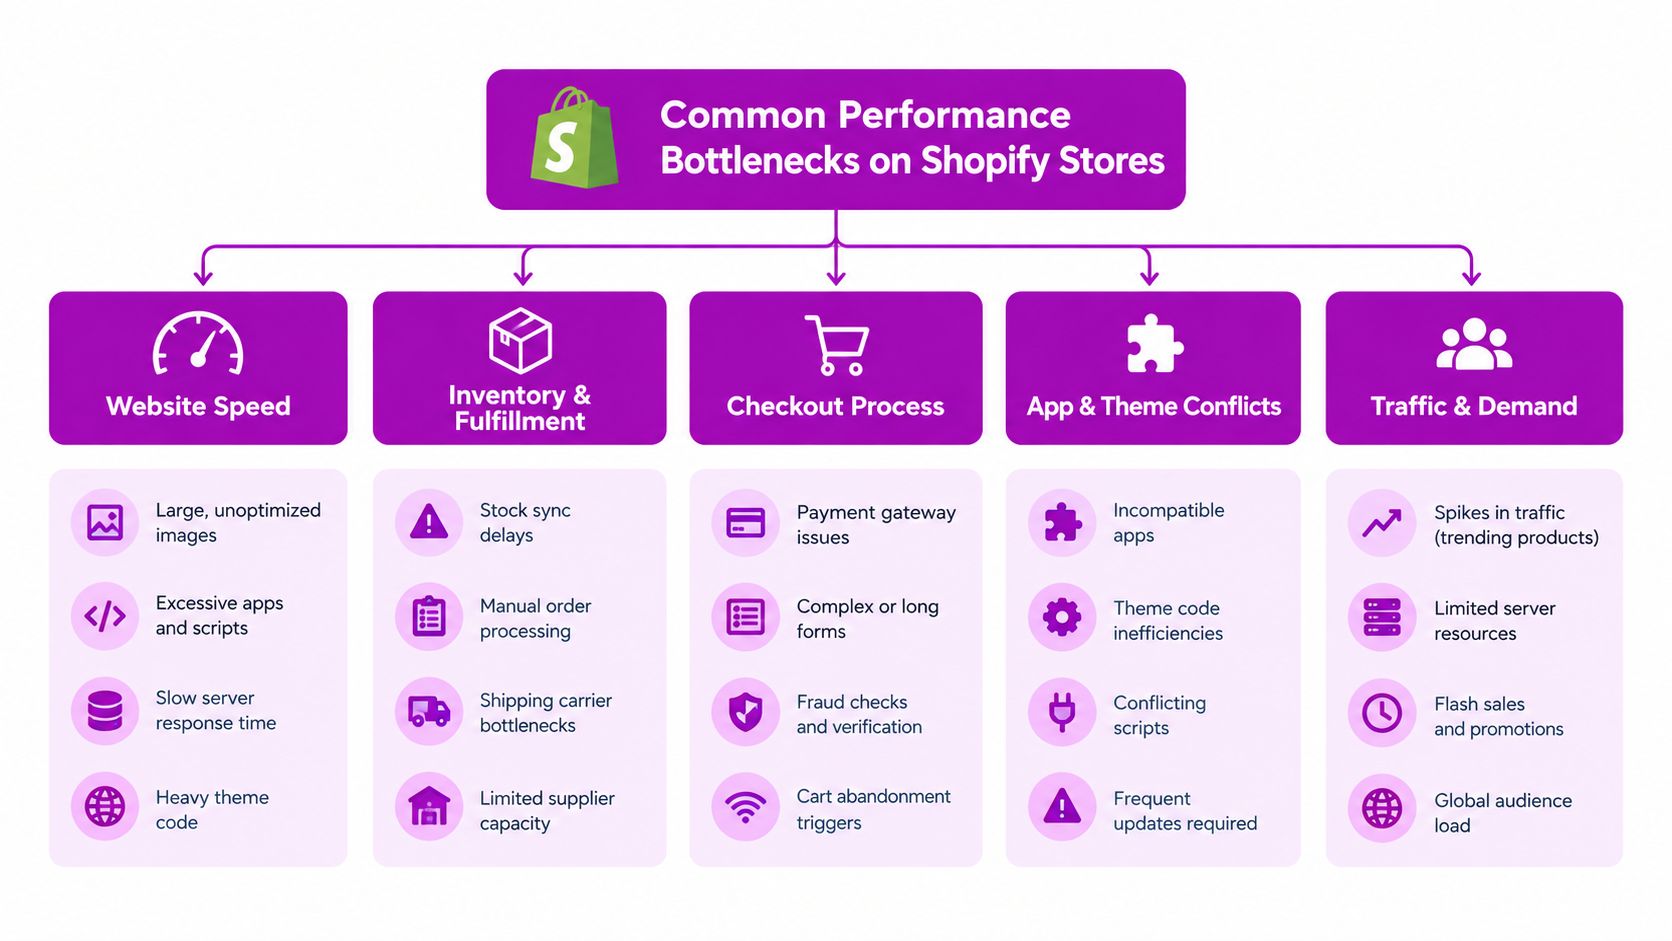
Finally, don't assume the three scored pages represent every important journey. Product variants, checkout-adjacent interactions, campaign landing pages, and app-heavy templates can behave differently. Your diagnosis should follow shopper value, not only the pages included in the blended score.
Prioritized Optimization Tactics That Protect Conversions
Performance work becomes risky when teams remove anything that looks expensive without asking what the feature does for buyers. A review widget may add JavaScript but support purchase confidence. A product gallery may require more assets but help shoppers evaluate the item. The best fixes reduce unnecessary browser work while preserving the path to purchase.
Start with the element that combines high visibility, high traffic, and clear technical waste. A correctly sized hero or primary product image is often safer to address than a major redesign. Removing unused app scripts can also produce a broad improvement without changing the storefront's visible experience.
Optimization Impact vs Effort Matrix
| Tactic | Primary Vital Improved | Effort | Conversion Risk |
|---|---|---|---|
| Serve the correct responsive size for hero and primary product images | LCP | Low to medium | Low, if visual quality stays consistent |
| Reserve dimensions for images, fonts, and app blocks | CLS | Low to medium | Low |
| Defer non-critical scripts that don't control immediate shopping actions | INP and LCP | Medium | Medium, test widgets and tracking |
| Audit and remove unused apps or duplicate functionality | INP, LCP, and CLS | Medium | Medium, verify affected journeys |
| Load feature scripts only on the templates that need them | INP and LCP | Medium | Low to medium |
| Simplify a heavy hero slider or animation | LCP and CLS | Medium to high | Medium, validate engagement |
| Replace a heavily bloated theme architecture | Multiple vitals | High | High, use a duplicate theme and test thoroughly |
The matrix is a prioritization tool, not a universal order. If real-user data shows a product page has weak INP, reducing main-thread JavaScript should come before adjusting a minor image. If LCP is the dominant issue, look at the actual largest element and its request priority rather than compressing every image in the catalog.
Conversion protection matters: Keep variant selection, add-to-cart behavior, consent requirements, and other immediate shopping functions reliable while delaying non-essential work.
App audits deserve a careful process. List every app that touches the storefront, identify where it loads, and check whether the feature remains active. An app that appears only on product pages shouldn't automatically ship its assets across the homepage and collection templates. Uninstalling an app may also leave theme code behind, so changes should be made in a duplicate theme and tested before publication.
Above-the-fold content needs restraint. One clear hero image can outperform a complex slider from a performance perspective, but the business decision should include merchandising goals and mobile usability. Likewise, deferring a chat widget can be sensible, while deferring the script required for a variant choice can damage the buying experience.
The most valuable optimization often reduces main-thread blocking, stabilizes the page, and improves hero rendering at the same time. Single-metric tweaks can help, but they rarely deserve priority over a clear template bottleneck.
How to Measure Speed Correctly Beyond the Admin Score
A store can show a reasonable blended score while mobile shoppers struggle on a product page. Measure the page types and devices that matter commercially, then use each tool for the question it can answer. Shopify's web performance reports cover real store traffic across the available 90-day reporting period and support windows such as Today, Last 7 days, and Last 30 days. They help you monitor trends and Core Web Vitals from shoppers, as explained in Shopify's web performance reports.
Lighthouse and PageSpeed Insights support controlled diagnosis. Run them against a specific URL to inspect the LCP element, locate blocking resources, and compare a theme change before publishing it. Treat these results as investigation snapshots, not as direct predictions of field performance. A lab test may expose a cause, while real-user data shows whether that cause affects shoppers at scale.
A measurement workflow for busy teams
- Choose representative URLs. Test the homepage, a high-traffic product page, a collection page, and important campaign landing pages. This creates a three-page template signal without pretending one URL represents the entire store.
- Test mobile first. Review rendering, interaction delay, layout stability, and resources loaded before the main content.
- Record the actual issue. Note the LCP element, delayed interaction, or content block that shifts.
- Apply one meaningful change. Keep theme, app, image, and tracking changes separate so the result remains clear.
- Compare field data over a consistent window. Daily movement can be noisy, so avoid reacting to one reading.
- Segment the result. Compare page type, device, and relevant geography where reporting supports it.
The guide to measuring website performance explains how diagnostic tests and real-user monitoring work together. Use lab tools to find likely causes, then use field data to verify whether those causes affect shoppers.
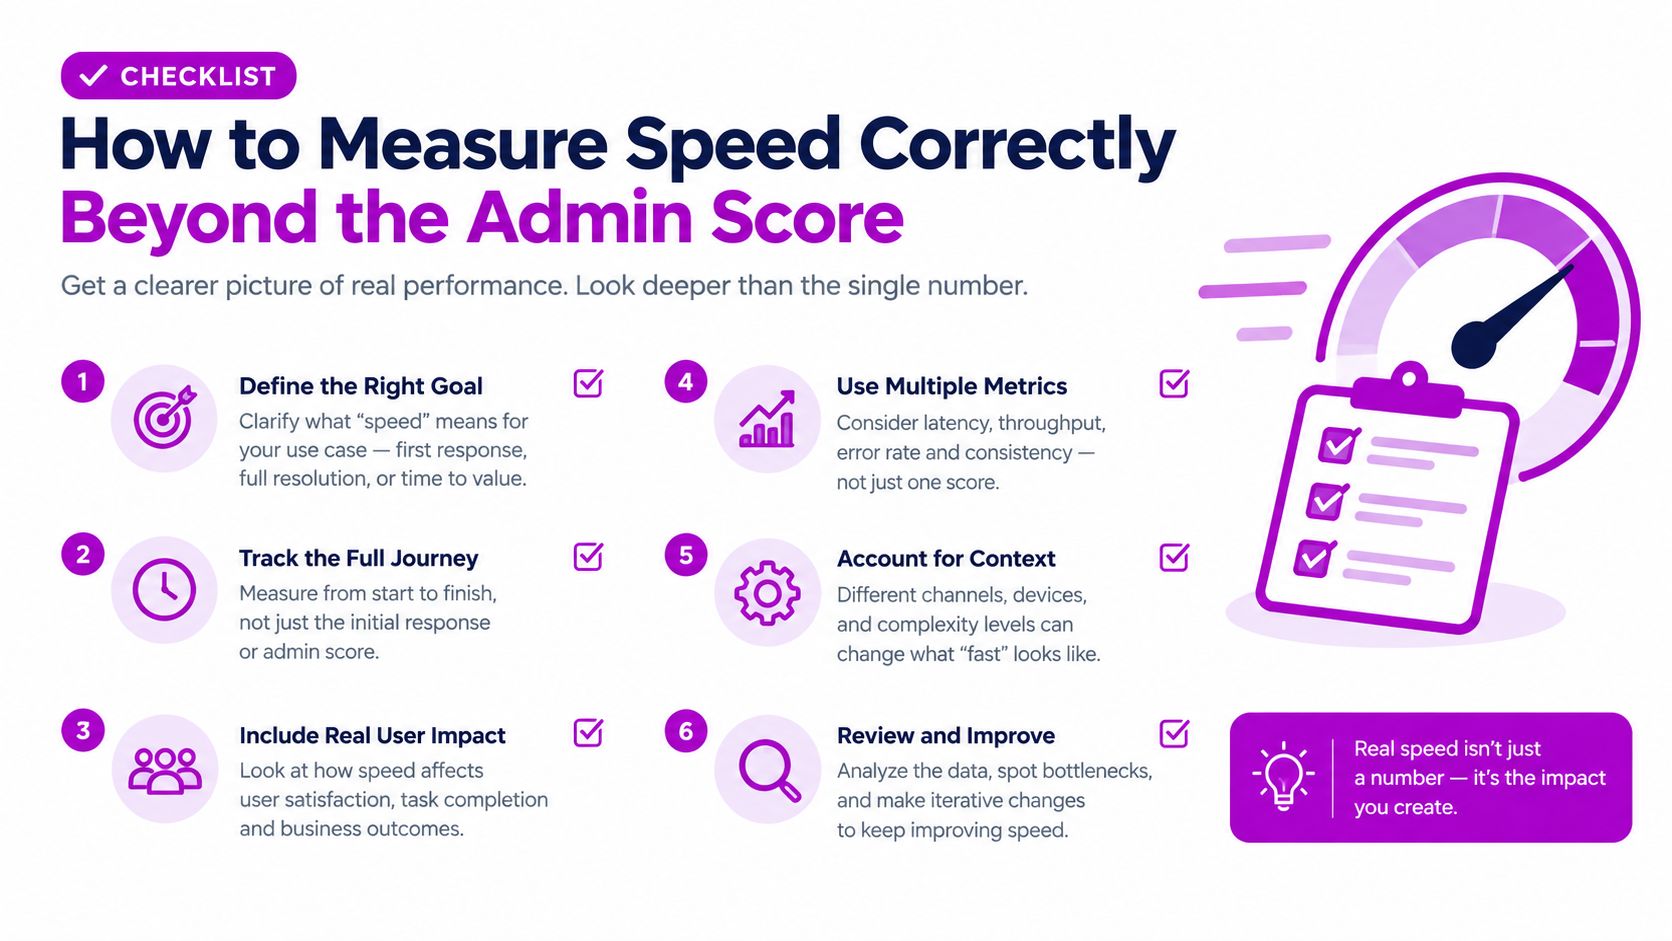
Stop chasing the admin score once it stops identifying the problem. Switch to page-type and device segments, and prioritize real-user Core Web Vitals where performance and conversion work meet.
Your Action Plan to Improve Shopify Speed Score Sustainably
Treat Shopify speed work like maintaining a store, not winning a one-time race. A high admin score can hide a slow product template on mobile, while a lower score may belong to a page type shoppers rarely visit. Start by mapping the three templates that matter most commercially, then inspect their Core Web Vitals by device.
Use this six-step sequence:
- Triage the template: Name the page type, device, and affected segment. For a mobile product page, record whether the issue appears on the main product template or only on products with many variants.
- Find the largest cost: Identify the LCP element, main-thread work, delayed content, and scripts competing before the first useful view.
- Remove unnecessary work: Review app assets, duplicate scripts, oversized product images, and global files loaded on every page.
- Protect the buying path: Test image galleries, variant selection, add-to-cart behavior, consent tools, reviews, and merchandising blocks. A faster page that breaks selection or cart actions is not an improvement.
- Re-measure field performance: Check the relevant Shopify report window and compare the same mobile product segment rather than the whole store.
- Connect performance to outcomes: Look for changes in engagement, product interaction, and conversion behavior, not only a higher score.
Consider a product template with a slow mobile LCP caused by a large first product image and an app script loading before the buying controls. First, confirm that template and device segment. Then compress or properly size the image, test the app's placement or loading behavior, and keep those changes separate. After the field data has had time to reflect the change, compare mobile product-page performance and add-to-cart behavior. If the score rises but shoppers still wait or abandon the page, continue investigating the bottleneck.
Shopify's ecosystem-level performance can be relatively strong. One source reports about 80% of Shopify stores passing all Core Web Vitals thresholds, which supports the case for template-level diagnosis in this Shopify Core Web Vitals guide. That figure describes a broad sample, not your shoppers, so use it as context rather than a target.
The Shopify site-speed guidance from Shopify Enterprise also shows why benchmark results need careful interpretation. Different samples can produce different outcomes, so inspect your own page types and devices before funding another round of general optimization.
The guide to measuring website performance explains how lab diagnostics and real-user monitoring work together. Use lab tools to locate likely causes, then field data to check whether those causes affect shoppers.
Stop chasing the admin score when it no longer identifies a real-user problem. Reopen the review after a major theme change, app installation, campaign launch, or noticeable mobile complaint. ECORN can audit Shopify themes and connect performance findings with CRO and storefront development decisions. Visit ECORN to discuss a page-type review based on your store's user data.


Shopify Mobile Optimization: The 2026 Playbook

How to Add Subcategory in Shopify for Better UX
How to Implement Structured Data for Ecommerce in 2026

SEO App Mobile: Shopify Store Optimization Guide

Shopify Plus Support: What It Includes and How to Choose

Google Ads for Shopify: The Complete 2026 Playbook

Shopify New York: How to Find and Hire the Right Agency

Google Search Console for Shopify: The Complete Setup

First Party Data Collection for eCommerce Growth
FAQ Online Store Guide: Build and Measure It Right

Do FB Ads Work for eCommerce in 2026?

One Page Checkout for Shopify: Design and Implementation
Shopify GraphQL vs REST: The 2026 Developer Decision
Shopify Ecommerce Consulting: Strategy, Pricing &

Are Reddit Ads Worth It for eCommerce Brands

Shopify Title and Meta Description: A Practical 2026 Guide

Product Video Best Practices for Shopify Brands
Real-Time Inventory Management: A 2026 Guide

AI Chatbot Integration for Shopify Stores

Affiliate Program Management: A Shopify Guide
10 Best Performance Monitoring Tools for Shopify in 2026

Digital Asset Management for eCommerce Brands in 2026

Every Type of Facebook Ads Explained for eCommerce Growth
Product Information Management Explained for Shopify Brands

Support Ticket System: A Guide for Shopify Stores

10 Best Customer Service Tools for Shopify in 2026

Can I Start a Business with No Money? a 2026 Blueprint

What Sells Good on Etsy: Best Niches for 2026

Shopify Add to Cart Button: A Practical 2026 Guide

Customer Feedback Automation: A Practical eCommerce Guide

Critical Rendering Path: A Guide for Shopify Stores

How to Promote on TikTok for eCommerce in 2026

B2B eCommerce Consulting That Drives Real Revenue

10 Best Practices for Site Navigation in 2026
Return vs Refund for Shopify Stores: A Practical Guide

What Is Customer Lifetime Value and Why It Matters

What Is Voice of Customer Research for eCommerce

SMS Marketing for Ecommerce That Actually Converts

Master How to Improve Email Deliverability in 2026

Top 7 eCommerce Partners NYC for Shopify Brands in 2026

Machine Learning for Ecommerce: Boost Your Shopify Store

Beauty Market Research: Your 2026 Growth Guide

Shopify International Expansion: A 2026 Roadmap

What Does CRO Stand for in Business: Understanding CRO

Shopify Visual Merchandising: A Playbook for Higher Sales

Shopify Landing Page Design: Master Conversion in 2026

10 Best AI SEO Optimization Tools for Shopify in 2026

Agentic AI for Ecommerce: Boost Your Sales in 2026
Mastering Email Marketing Data for eCommerce Growth

Conversion Rate Optimisation Australia: Boost Your Sales
Conversion Rate Optimization AI: Your Shopify Store Guide

10 Product Bundling Strategies for Shopify in 2026

How to Increase Customer Lifetime Value: A Shopify Playbook

AI Customer Service Automation: Shopify Guide 2026

Clean Website Design: A Shopify Conversion Playbook

Omnichannel Retail Strategy: A Shopify Playbook
Product Data Enrichment: A Guide for Shopify Brands

Instagram Shopping Features a Guide for Shopify Stores

What Is Revenue Optimization: A Holistic RevOps Guide

Benefits of Conversion Rate Optimization: Boost Your
WordPress to Shopify Migration: Your 2026 Seamless Switch
Boost Sales: Ecommerce Payment Processing Guide 2026
Unified Commerce Platform: Benefits, KPIs & Shopify Guide

How to Reduce Bounce Rate eCommerce: Your 2026 Guide
Shopify API Integration: A Practical End-to-End Guide

How to Implement Data Governance: A 2026 Guide
Shopify Store Development Cost: A 2026 Breakdown
What Is Server Side Tracking: The Shopify Guide 2026
Marketing Automation Workflows: A Shopify Guide for 2026

Shopify: How to Reduce Technical Debt

Shopify UX Design Change: A Playbook for Growth

User Generated Content Strategy: Shopify Playbook

Shopify Pause and Build Plan Cost: A Complete 2026 Guide
Compare at Price on Shopify: A Complete Guide for 2026
Where Can I Sell My Prints? 10 Best Platforms for 2026
Shopify Order Management System: The Ultimate Guide 2026
What Is Marketing Attribution? an eCommerce Guide for 2026

10 Best Black Friday Sales Sheets for 2026

Discover the Top Social Media Marketing Agencies For

Consumer Confidence Definition for eCommerce in 2026

What Is Social Commerce? Your 2026 Guide to Boosting Sales

A Social Ad Campaign Playbook for eCommerce Growth

7 Best FAQ Page Examples for SaaS & eCommerce

Market Research in Fashion Industry: A Guide for Shopify

Shopify Migration Services: Expert Guide for 2026

Mastering FB Retargeting Ads for Shopify in 2026
What Is Omnichannel Ecommerce

Master Your Shopify Plus Migration: The 2026 Guide

Shopify Integration Services: A Merchant's 2026 Guide

Shopify Collection Description: A Guide to SEO & Sales

Shopify Plus Contact: Reach Sales & Support Effectively

Top Luxury Shopify Stores: Design & UX Strategies
How to Improve Customer Experience: A Shopify Roadmap

Creative Facebook Ads: 10 Examples for Shopify Brands

Remarketing with Facebook Ads: A Shopify Guide for 2026

SEO Linking Strategies for Shopify Stores
Top 7 Statistics YouTube Channels for eCommerce in 2026

Hiring Shopify Plus Designers: A Founder's Guide

Shopify Product Variation: Master Your Variants for 2026

Leverage Ai Solutions Brands: Your 2026 Shopify Growth Guide


newsletter in your inbox